. 2012 Sep 14;150(6):1223-34.
doi: 10.1016/j.cell.2012.07.029.

Pancreatic β cell dedifferentiation as a mechanism of diabetic β cell failure

Affiliations

Pancreatic β cell dedifferentiation as a mechanism of diabetic β cell failure

Chutima Talchai et al. Cell. .

Abstract

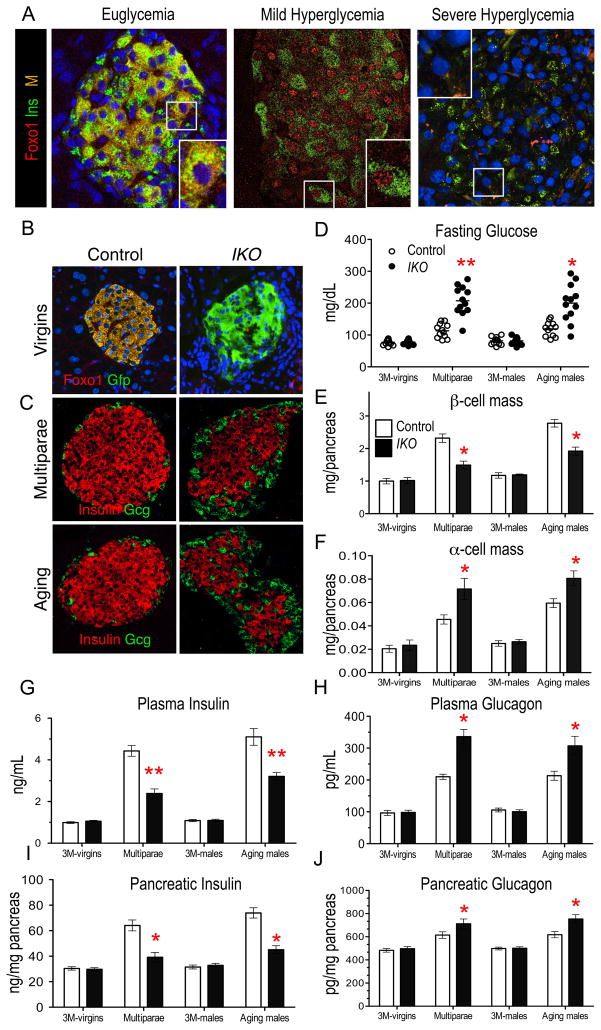
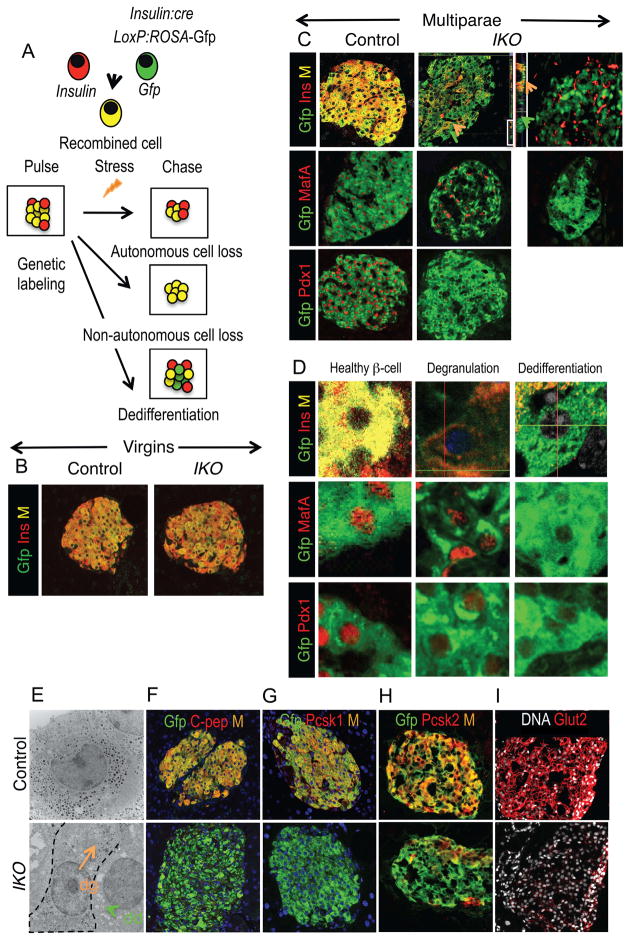
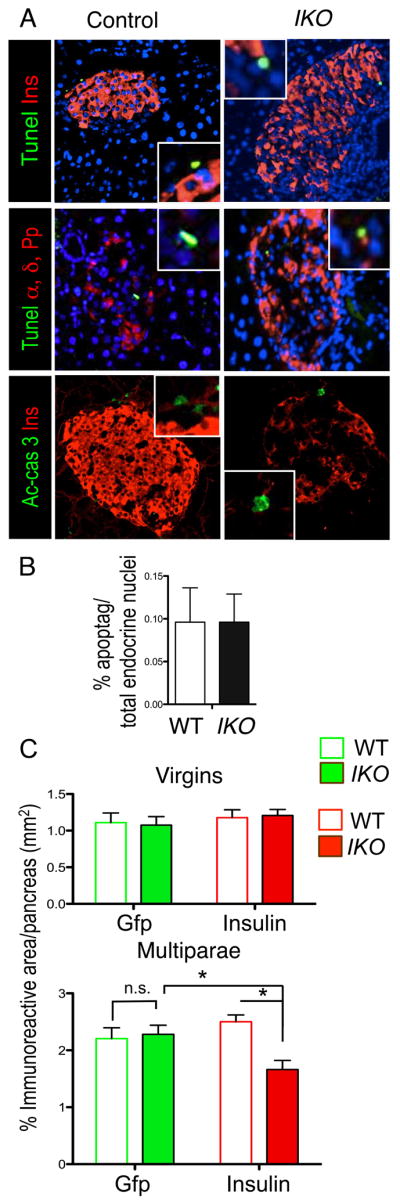
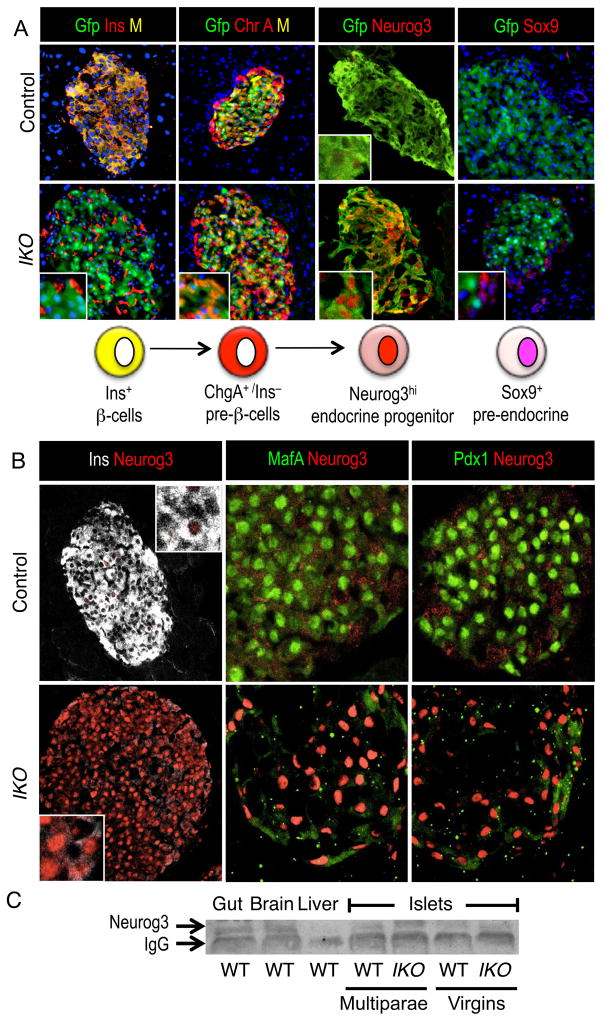
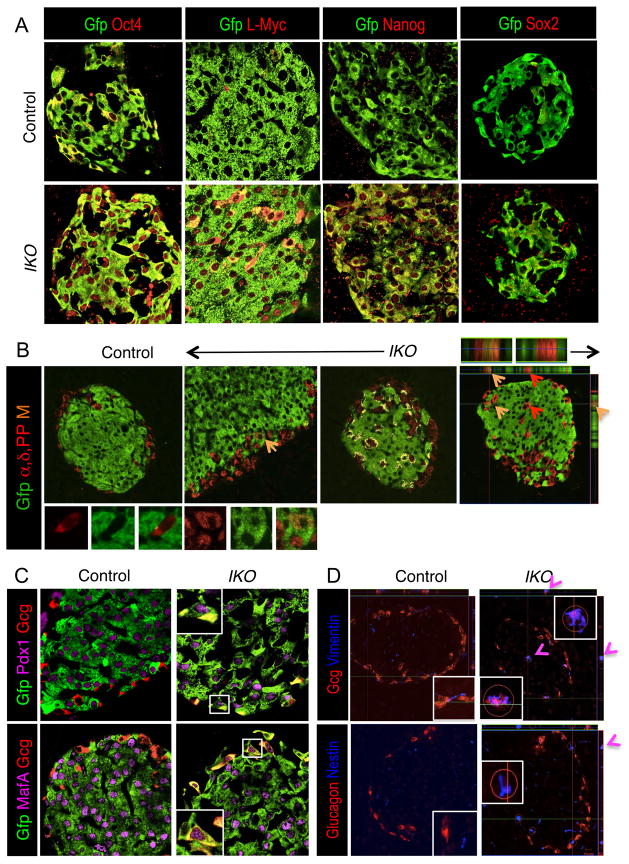
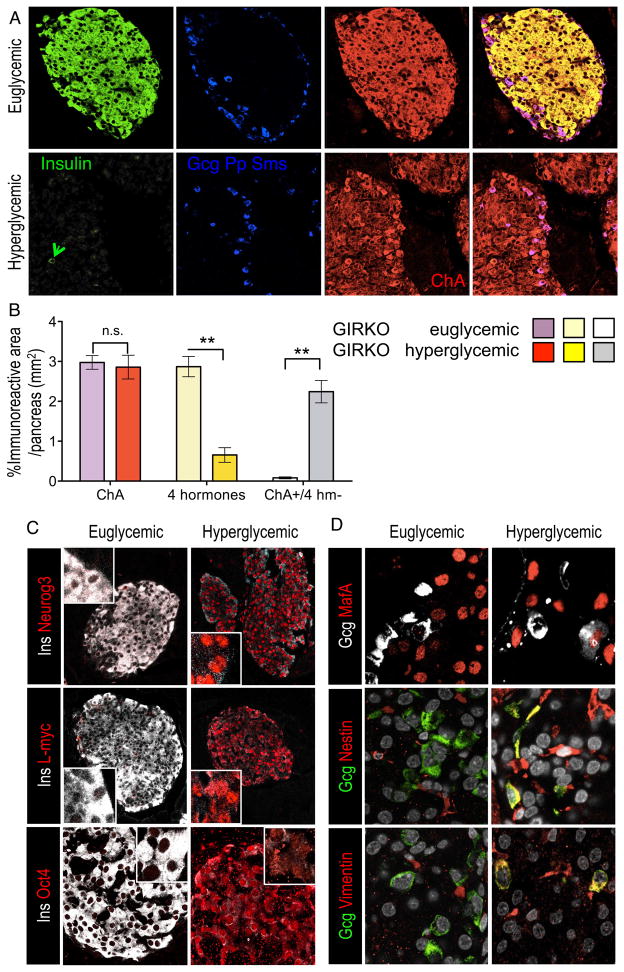
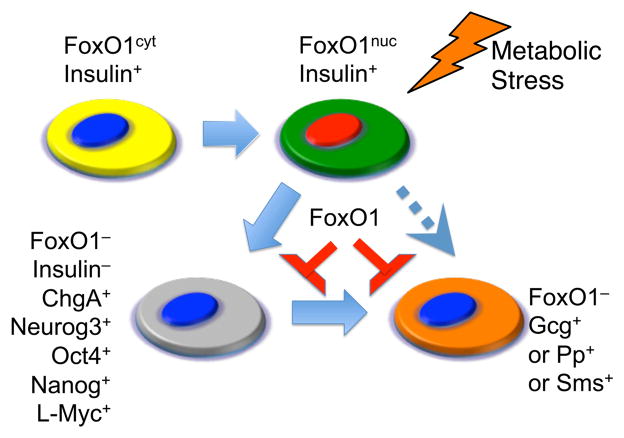
Diabetes is associated with β cell failure. But it remains unclear whether the latter results from reduced β cell number or function. FoxO1 integrates β cell proliferation with adaptive β cell function. We interrogated the contribution of these two processes to β cell dysfunction, using mice lacking FoxO1 in β cells. FoxO1 ablation caused hyperglycemia with reduced β cell mass following physiologic stress, such as multiparity and aging. Surprisingly, lineage-tracing experiments demonstrated that loss of β cell mass was due to β cell dedifferentiation, not death. Dedifferentiated β cells reverted to progenitor-like cells expressing Neurogenin3, Oct4, Nanog, and L-Myc. A subset of FoxO1-deficient β cells adopted the α cell fate, resulting in hyperglucagonemia. Strikingly, we identify the same sequence of events as a feature of different models of murine diabetes. We propose that dedifferentiation trumps endocrine cell death in the natural history of β cell failure and suggest that treatment of β cell dysfunction should restore differentiation, rather than promoting β cell replication.


Figures

Figure 1
Figure 1. FoxO1 Localization During Diabetes Progression And Foxo1 Knockout
(A) Immunofluorescence with insulin (green), and FoxO1 (red) in euglycemic (glucose=100 mg/dl), mildly hyperglycemic (glucose=150–250 mg/dl) db/db mice, and severely hyperglycemic GIRKO mice (glucose > 500 mg/dl) (n = 10). Insets show representative β-cells. (B) Lineage tracing analysis of recombination at the Foxo1 locus in IKO:RosaGfp and control mice (Ins2-Cre:Foxo1fl/+;RosaGfp or Ins2-Cre:Foxo1+/+;RosaGfp) using Gfp (green, indicates recombination) and FoxO1 antibodies (red) in pancreata from 3-month-old mice (n = 3). (C) Islet morphology and immunohistochemistry with insulin (red) and glucagon (Gcg, green) in multiparous or aging (16- to 20-month-old) wild-type and IKO mice (n = 4). (D) Fasting blood glucose. (E) β-cell mass. (F) α-cell mass. (G) Fed plasma insulin. (H) Fed plasma glucagon. (I) Pancreatic insulin content. (J) Pancreatic glucagon content. (n = 8–16 for blood metabolite analyses, n = 4 for morphometry and n=8 for pancreatic hormone content). Data represent means ± SEM. * = p <0.05, and ** = p <0.01 by Student’s t-test.
Figure 2
Figure 2. Lineage-Tracing Of β-Cells In Multiparae
(A) Experimental design and expected outcomes of lineage-tracing experiments. (B) Immunofluorescence with Gfp (green) and insulin (red) in IKO:RosaGfp and control RosaGfp virgins. (C) Immunofluorescence with Gfp (green) and insulin, Pdx1, or MafA antibodies (red) in IKO:RosaGfp and control RosaGfp multiparae. Middle and right panels show representative islets with moderate (middle) and extreme degrees (right) of loss of insulin immunoreactivity. (D) Immunofluorescence with Gfp (green) and insulin, Pdx1, or MafA (red), showing degranulated (orange) and dedifferentiated (green) β-cells inIKO:RosaGfp multiparae (n = 4 for each group). (E) Electron microscopy showing a representative wild-type β-cell (left) and a degranulated (orange arrow, dg) or a dedifferentiated β-cell (green arrow, dd) in IKO multiparae. (F–I) Immunohistochemistry with Gfp (green) and Pcsk2, Glut2, Gck, and Pcsk1 (red) in recombined β-cells of multiparous IKO:RosaGfp and control RosaGfp mice. In some sections, DNA is counterstained with DRAQ5 (blue or white). Insets represent individual color channels. (J) qPCR analysis of Pdx1, MafA, Nkx6.1, NeuroD1, Pcsk2, Gck, and Glut2 in islets isolated from control and IKO mice (n=4 for histology, and n=4 for qPCR). Data show means ± SEM. * = P <0.05, and ** = p <0.01 by Student’s t-test.
Figure 3
Figure 3. Analysis Of β-Cell Survival In FoxO1-Deficient Mice
(A) TUNEL assay or active-caspase 3 (green) in insulin- and glucagon-immunoreactive cells (red) of multiparous wild-type and IKO mice. (B) Quantification of apoptotic nuclei as detected by TUNEL assays in wild-type and IKO mice (n = 8). (C) Quantification of Gfp (green) or insulin immunoreactive area (red). The pixel area was converted to mm2 and plotted as percentage of total pancreas area (also expressed in mm2) from virgins and multiparae (n= 4 for each group). Data show means ± SEM. * = P<0.05 by Student’s t -test.
Figure 4
Figure 4. Staging Of Differentiation Of FoxO1-Deficient β-Cells
(A) Immunofluorescence with Gfp (green, indicating recombined β-cells) and insulin (red, left panels), or ChgA (red, central panels), Neurog3 (red, central right panels), Sox9 (red, right panels) in multiparous IKO:RosaGfp and control RosaGfp mice. DNA is counterstained with DAPI. (B) Immunofluorescence with insulin (white), and Neurog3 (red, left panels), Pdx1 or MafA (green), and Neurog3 (red, central and right panels) in multiparous IKO and wild-type mice. (C) Neurog3 immunoblotting in the indicated tissues. Data represent means ± SEM (n=4). * = P <0.05 by Student’s t-test.
Figure 5
Figure 5. Multipotency And Plasticity Of Dedifferentiated β-Cells
(A) Immunofluorescence with Gfp (green, indicating recombined β-cells) and Oct4 (red, left panels), or L-Myc (red, central panels), Nanog (red, central right panels), Sox2 (red, right panels) in multiparous IKO:RosaGfp and control RosaGfp mice. (B) Immunofluorescence with Gfp (green) (recombined cells) and a cocktail of glucagon (labeling α-cells), pancreatic polypeptide (Pp cells), and somatostatin (δ-cells) antibodies (red) in multiparous and aging IKO:RosaGfp and control RosaGfp mice. Orange arrows indicate merged fluorescence (M); red arrows indicate pre-existing α, δ, and Pp-cells. Insets illustrate representative cells. In the central right panel, the yellow area shows automatic localization assigned by software analysis of confocal images. Boxed regions (non-β-cells) are shown at higher magnification on top. The far right panel demonstrates a representative z-stack of confocal images showing co-localization of merged fluorescence to the same cell. (C) Immunohistochemistry with Gfp (green, indicating recombined β-cells), and Pdx1, or MafA (magenta) and glucagon (Gcg, red) in IKO and wild-type multiparae. (D) Immunohistochemistry with glucagon (red) and nestin or vimentin (blue) in IKO and wild-type multiparae, including representative z-stacks of confocal images (n = 4–6 in all panels).
Figure 6
Figure 6. β-Cell Dedifferentiation In Diabetes (GIRKO Mice)
(A) Immunohistochemistry with insulin (green), combined glucagon (gcg), pancreatic polypeptide (Pp), somatostatin (Sms) (blue) and ChgA (red). (B) Quantification of area of ChgA-immunoreactive area (red), 4-hormone-immunoreactive area (insulin, glucagon, Pp, somotatostatin) (yellow), and their ratios (grey). The pixel area was converted to mm2 and plotted as percentage of total pancreatic area (also expressed in mm2) (n= 5 for each group). Data show means ± SEM. * = P<0.05 by Student’s t -test. (C) Immunohistochemistry with insulin (white) and Neurogenin3, L-Myc, or Oct4 (red). (D) Immunohistochemistry with glucagon (white) and MafA (red) (top panels); or glucagon (green) and vimentin (red) (middle panels); or glucagon (green) and nestin (red) (bottom panels) (n=4 for each group).
Figure 7
Figure 7. Proposed Mechanism Of β-Cell Failure
Healthy β-cells produce insulin and have cytoplasmic FoxO1 (yellow). In the early phases of metabolic stress, insulin production (green) is maintained, but FoxO1 undergoes nuclear translocation to enforce the β-cell fate (red). If the stress persists, FoxO1 expression declines (blue nucleus) as Neurog3, Oct4, Nanog, and L-Myc are reactivated, and β-cell transcription factors are unable to forestall a drop in insulin production (grey). The outcome is twofold: most former β-cells revert to an uncommitted endocrine progenitor stage (grey). A subset of cells undergoes conversion into other hormone-producing cells (orange).

Comment in

References

    1. Accili D, Ahren B, Boitard C, Cerasi E, Henquin JC, Seino S. What ails the beta-cell? Diabetes Obes Metab. 2010;12(Suppl 2):1–3. - PubMed
    1. Accili D, Drago J, Lee EJ, Johnson MD, Cool MH, Salvatore P, Asico LD, Jose PA, Taylor SI, Westphal H. Early neonatal death in mice homozygous for a null allele of the insulin receptor gene. Nat Genet. 1996;12:106–109. - PubMed
    1. Al-Masri M, Krishnamurthy M, Li J, Fellows GF, Dong HH, Goodyer CG, Wang R. Effect of forkhead box O1 (FOXO1) on beta cell development in the human fetal pancreas. Diabetologia. 2010;53:699–711. - PubMed
    1. Basu-Roy U, Seo E, Ramanathapuram L, Rapp TB, Perry JA, Orkin SH, Mansukhani A, Basilico C. Sox2 maintains self renewal of tumor-initiating cells in osteosarcomas. Oncogene. 2012;31:2270–2282. - PMC - PubMed
    1. Butler PC, Meier JJ, Butler AE, Bhushan A. The replication of beta cells in normal physiology, in disease and for therapy. Nat Clin Pract Endocrinol Metab. 2007;3:758–768. - PubMed

Publication types

MeSH terms