. 2012 Sep 14;150(6):1235-48.
doi: 10.1016/j.cell.2012.07.021.

A spatially-organized multicellular innate immune response in lymph nodes limits systemic pathogen spread

Affiliations

A spatially-organized multicellular innate immune response in lymph nodes limits systemic pathogen spread

Wolfgang Kastenmüller et al. Cell. .

Abstract

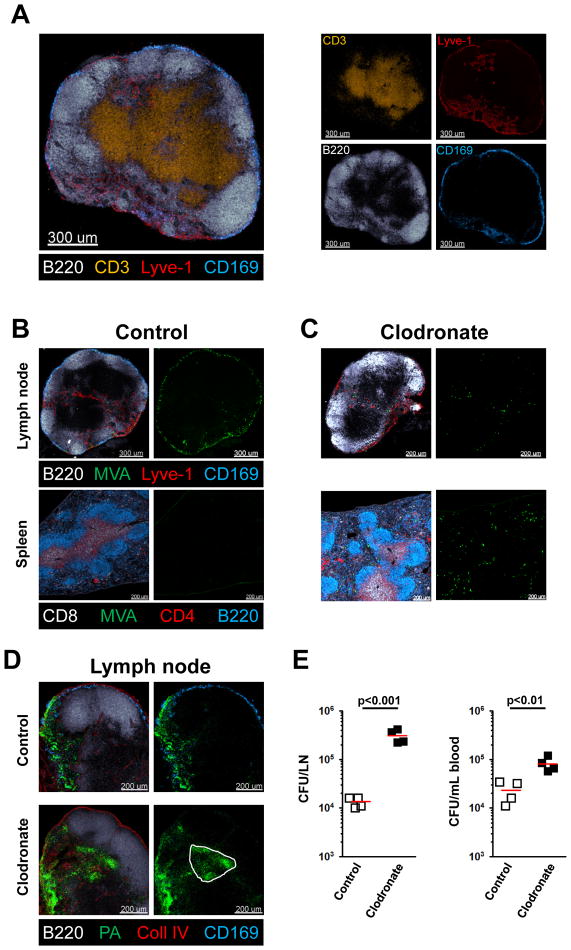
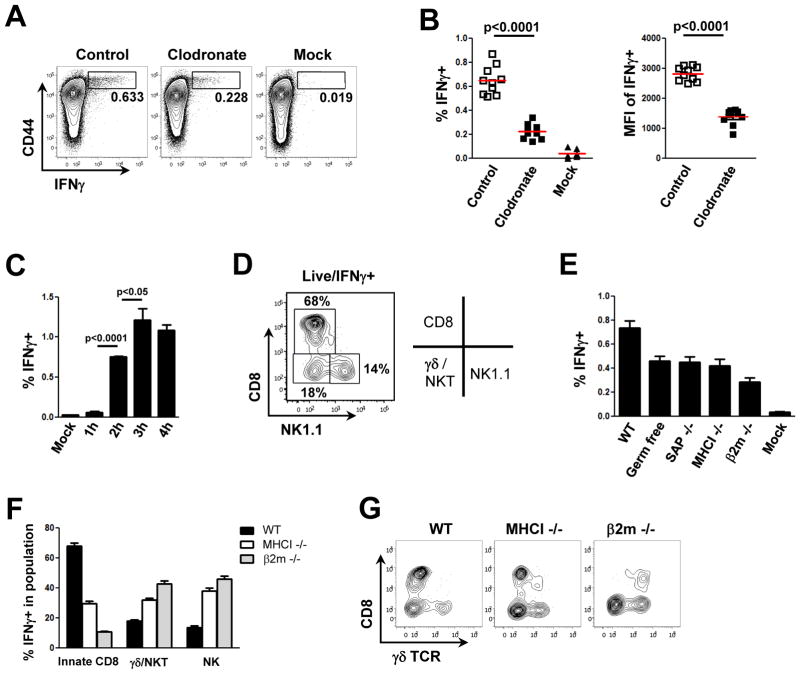
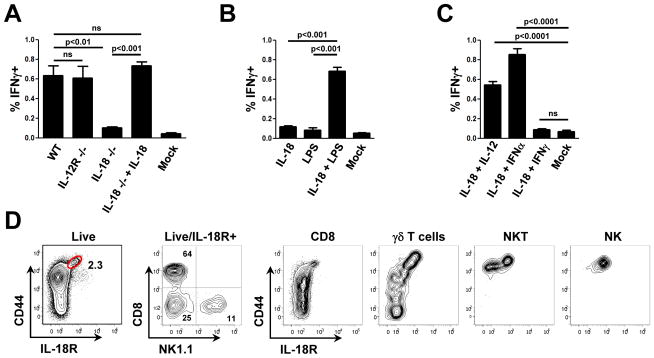
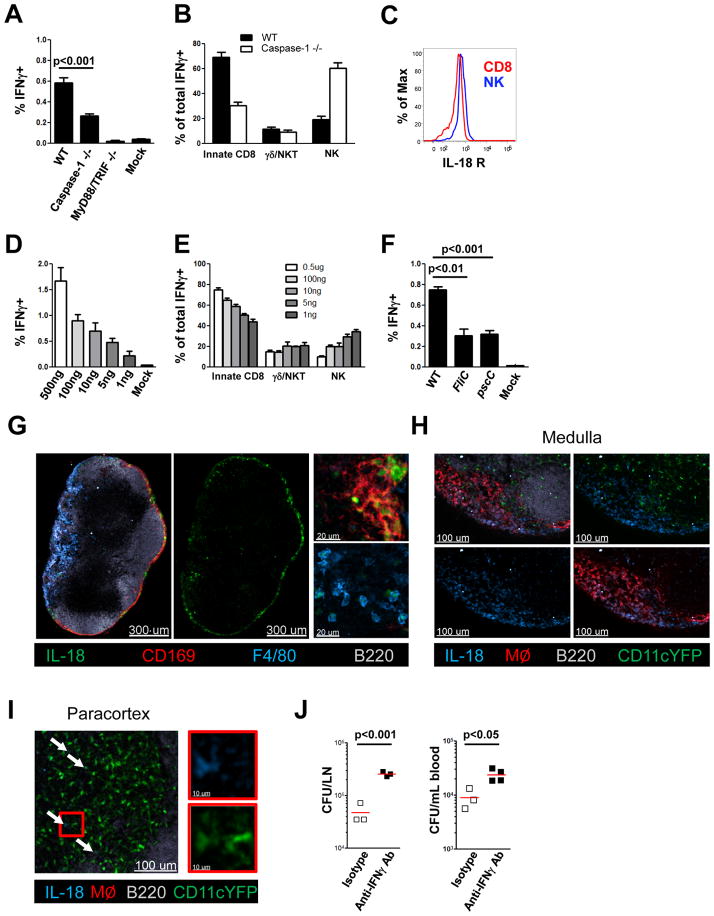
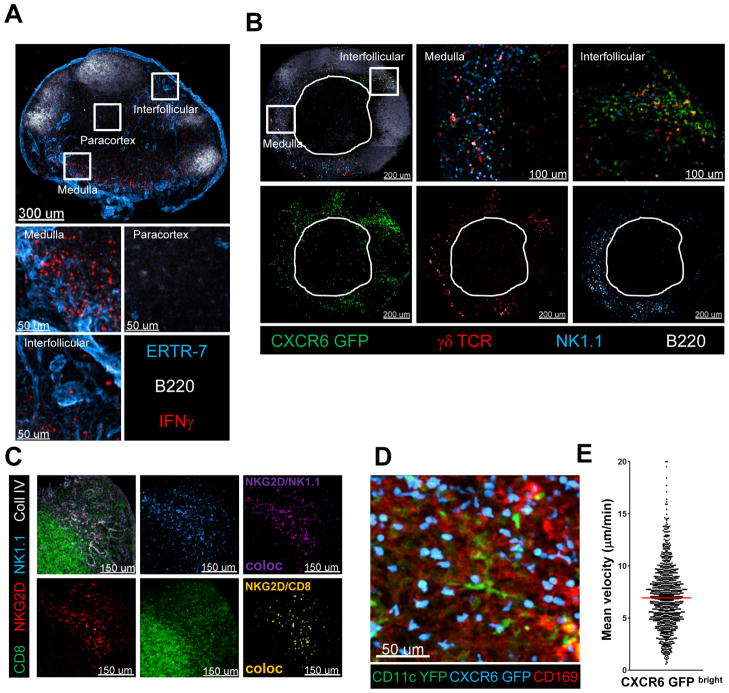
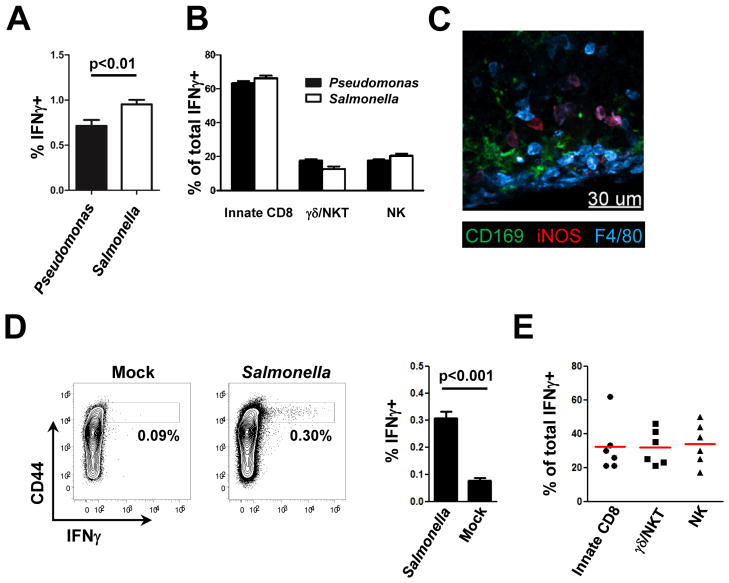
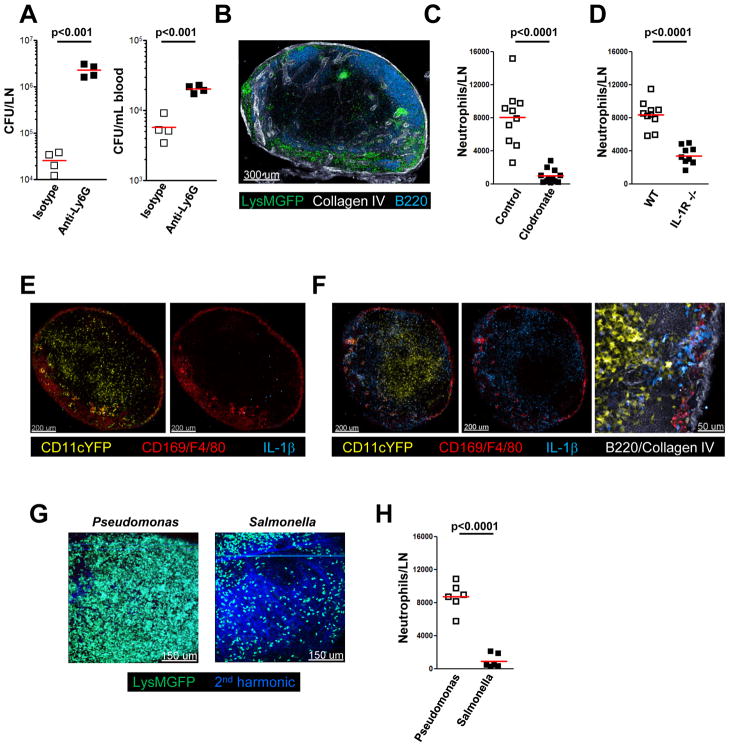
The lymphatic network that transports interstitial fluid and antigens to lymph nodes constitutes a conduit system that can be hijacked by invading pathogens to achieve systemic spread unless dissemination is blocked in the lymph node itself. Here, we show that a network of diverse lymphoid cells (natural killer cells, γδ T cells, natural killer T cells, and innate-like CD8+ T cells) are spatially prepositioned close to lymphatic sinus-lining sentinel macrophages where they can rapidly and efficiently receive inflammasome-generated IL-18 and additional cytokine signals from the pathogen-sensing phagocytes. This leads to rapid IFNγ secretion by the strategically positioned innate lymphocytes, fostering antimicrobial resistance in the macrophage population. Interference with this innate immune response loop allows systemic spread of lymph-borne bacteria. These findings extend our understanding of the functional significance of cellular positioning and local intercellular communication within lymph nodes while emphasizing the role of these organs as highly active locations of innate host defense.


Conflict of interest statement

The authors declare that they have no competing financial interests.

Figures

Figure 1
Figure 1. LN macrophages prevent systemic spread of pathogens
(A) Confocal immunofluorescence (IF) image showing the basic anatomy of a peripheral LN stained with antibodies to the indicated marker molecules. Colors of the word labels correspond to the colors of the stains here and throughout. (B, C) Confocal IF of draining LN and spleen 4h after s.c. infection with MVA-GFP. Mice were pretreated 7d before infection by s.c. injection of control (B) or clodronate-containing liposomes (C). (D, E) Confocal IF of a draining LN (D) and bacterial counts of blood and of LN homogenates (E) 8h after s.c. (foot-pad) infection with PA-GFP. Mice were pretreated 7d before infection by s.c. (calf) injection of control or clodronate-containing liposomes. Red bars = mean. The experiment is representative of three similar experiments and p values from two-tailed t test are shown (see also Figure S1).
Figure 2
Figure 2. Macrophages orchestrate an IFNγ response by activating various innate effector cells in the LN
Flow cytometric analysis of cells from a draining LN 4h after s.c. infection with PA-GFP. WT mice were pre-treated 7d before infection with control or clodronate-containing liposomes. (A–F) Analysis of intracellular IFNγ production. (A) Representative flow cytometry plots highlighting CD44hi IFNγ–positive cells (boxes); (B) frequency of IFNγ–positive cells (left) and mean fluorescent intensity of the IFNγ signal (right); each dot represents one mouse, red bar is the mean value; (C) kinetic analysis of IFNγ production after PA infection; (D) phenotypes of immune cell subtypes producing IFNγ; (E) comparison of the frequency of IFNγ-producing cells in various gene-deficient or germ-free mice 4h after PA infection; (F) comparison of IFNγ-producing immune cell subtypes in WT, MHCI KO, and β2mKO mice. (G) Representative flow cytometry plots of γδ TCR expression in WT, MHCI KO, and β2mKO mice. Graphs show mean value ± SEM of 1 representative from 3 independent experiments (n=3) (C) or shows pooled data from 3 independent experiments (n≥8), p values from two-tailed t test are shown (see also Figure S2).
Figure 3
Figure 3. IL-18 is required, but not sufficient to drive an IFNγ response by innate effector cells
(A) Intracellular IFNγ responses in cells from draining LNs 4h after infection with PA (± 0.5μg IL-18). (B, C) Intracellular IFNγ responses in cells from draining LNs from non-infected WT mice 4h after injection with IL-18 (0.5μg), LPS (1μg), IL-12 (0.25μg), IFNα (5000U), IFNγ (0.5μg), or combinations thereof. (D) Expression of IL-18R on lymphoid cell subsets in the LN. Representative flow cytometry plots of draining LNs of non-infected mice. Graphs in A–C show mean ± SEM from three mice per group and are representative of three similar experiments (see also Figure S3).
Figure 4
Figure 4. IFNγ production by innate effectors depends on inflammasome activation and caspase-1 cleavage
(A, B) Intracellular IFNγ in cells from draining LNs 4h after infection with PA. (A) Comparison of the frequency of IFNγ-producing cells and (B) IFNγ-producing immune cell subtypes for WT and various gene-deficient mice. (C) Histogram showing relative IL-18R expression of NK cells and CD8+/CD44hi T cells. (D, E) Intracellular IFNγ in cells from draining LNs 3h after non-infected WT mice were injected with graded amounts of IL-18 and LPS (1μg). (D) Frequency of IFNγ producing cells; (E) Immune cell subtypes producing IFNγ. (F) Intracellular IFNγ in cells from draining LNs 4h after infection with WT or mutant PA lacking functional flagellin (FliC) or T3SS (pscC). (G–I) Overview and magnified confocal IF images showing IL-18 staining in a non-infected LN from WT (G) or CD11cYFP mice (H/I). (J) Bacterial counts in dLN and blood of control or anti-IFNγ antibody-treated animals 8h after infection with PA. Graphs (A, B, D–F) show mean from three mice per group and are representative of three similar experiments. MØ = combined CD169 and F4/80 staining. White arrows indicate CD11cYFP/IL-18 double positive cells. p values from two-tailed t test are shown (see also Figure S4).
Figure 5
Figure 5. Innate effector cells are prepositioned in close proximity to LN resident macrophages in the steady–state
(A) Confocal IF images showing IFNγ expression in various compartments of a draining LN 4h after infection with PA. (B) Confocal IF images of a popliteal LN from a non-infected CXCR6gfp/gfp mouse. Innate immune cell subtypes in distinct LN compartments are indicated. The white outline shows the edges of the central paracortical T cell zone. (C) Confocal IF images of a non-infected WT LN. A colocalization channel for NKG2D/NK1.1 or NKG2D/CD8 was created to identify the localization of NK cells or innate-like CD8+ T cells, respectively. (D) CD11cYFP+/-CXCR6gfp/+ mice were injected with labeled CD169 antibody. Image shows the maximum projection of a z-stack (60μm) from the dLN acquired in situ using a 2-photon microscope. (E) Mean velocity analysis of CXCR6-GFPbright cells in situ. Data points represent individual cells from one experiment, representative of 5 similar experiments with mean value indicated (see also Movie S1/S2).
Figure 6
Figure 6. Salmonella typhimurium elicits an IFNγ response in the mLN after oral infection
(A, B) Intracellular IFNγ in cells from draining LNs 4h after s.c. infection with PA or ST. (A) Comparison of the frequency of IFNγ-producing cells and (B) IFNγ-producing immune cell subtypes. (C) Confocal IF image for iNOS localization in a draining LN 8h after infection with ST. (D, E) Analysis of intracellular IFNγ in cells from mLNs 48h after oral infection with ST. (D) Comparison of the frequency of IFNγ-producing cells and (E) IFNγ-producing immune cell subtypes. Graphs show mean ± SEM from 6 mice per group and are representative of two similar experiments. p values from two-tailed t test are shown (see also Figure S5).
Figure 7
Figure 7. Macrophages produce IL-1 that recruits neutrophils to the LN
(A) Effect of neutrophil depletion on bacterial counts in blood and dLN 8h after s.c. infection with PA. Mice were pretreated 24h before with isotype control or anti-Ly6G antibody. (B) Confocal IF image of draining LN from LysMgfp/gfp mice 4h after s.c. infection with PA. (C) Flow cytometric analysis of neutrophil (CD11b+/Ly6G+) numbers in draining LN 4h after s.c. infection with PA. WT mice were pre-treated 7d before infection with control or clodronate-containing liposomes (D) Flow cytometric analysis of neutrophil (CD11b+/Ly6G+) numbers in the draining LN of WT and IL-1R KO mice 4h after s.c. infection with PA. (E, F) Confocal IF images of IL-1β localization in dLN of non-infected (E) or PA infected (2h) (F) CD11cyfp/yfp mice. (G) LysMgfp/gfp mice were infected with PA or ST for 4h. Images show the maximum projection of a z-stack (90μm) from the dLN acquired in situ using a 2-photon microscope. (H) Analysis of neutrophil (CD11b+/Ly6G+) numbers in dLN of WT mice 4h after s.c. infection with PA or ST. Data are representative of 3 independent experiments (A, H) or shows pooled data from 3 independent experiments (C, D). Bars show mean values. p values from two-tailed t test are shown.

References

    1. Alitalo K. The lymphatic vasculature in disease. Nat Med. 2011;17:1371–1380. - PubMed
    1. Asano K, Nabeyama A, Miyake Y, Qiu CH, Kurita A, Tomura M, Kanagawa O, Fujii S, Tanaka M. CD169-positive macrophages dominate antitumor immunity by crosspresenting dead cell-associated antigens. Immunity. 2011;34:85–95. - PubMed
    1. Bajenoff M, Breart B, Huang AY, Qi H, Cazareth J, Braud VM, Germain RN, Glaichenhaus N. Natural killer cell behavior in lymph nodes revealed by static and real-time imaging. J Exp Med. 2006a;203:619–631. - PMC - PubMed
    1. Bajenoff M, Egen JG, Koo LY, Laugier JP, Brau F, Glaichenhaus N, Germain RN. Stromal cell networks regulate lymphocyte entry, migration, and territoriality in lymph nodes. Immunity. 2006b;25:989–1001. - PMC - PubMed
    1. Barral P, Polzella P, Bruckbauer A, van Rooijen N, Besra GS, Cerundolo V, Batista FD. CD169(+) macrophages present lipid antigens to mediate early activation of iNKT cells in lymph nodes. Nat Immunol. 2010;11:303–312. - PMC - PubMed

Publication types