. 2012 Oct 5;91(4):608-20.
doi: 10.1016/j.ajhg.2012.08.007. Epub 2012 Sep 13.

A population-based study of autosomal-recessive disease-causing mutations in a founder population

Affiliations

A population-based study of autosomal-recessive disease-causing mutations in a founder population

Jessica X Chong et al. Am J Hum Genet. .

Abstract

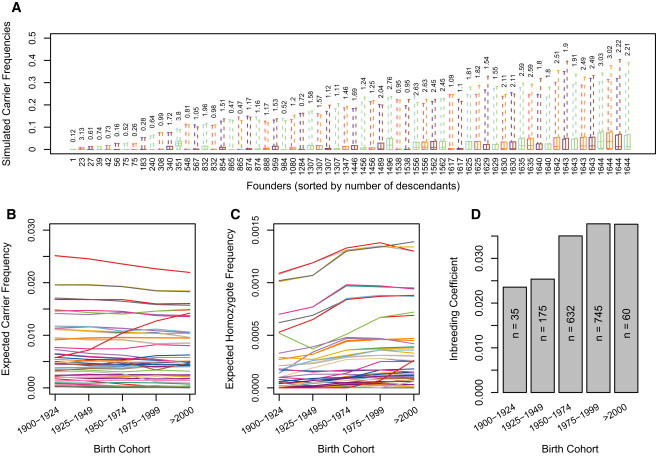
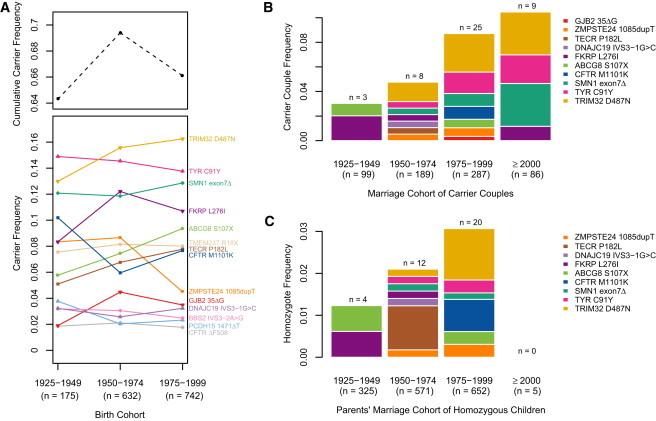
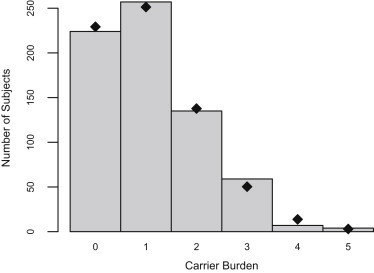
The decreasing cost of whole-genome and whole-exome sequencing has resulted in a renaissance for identifying Mendelian disease mutations, and for the first time it is possible to survey the distribution and characteristics of these mutations in large population samples. We conducted carrier screening for all autosomal-recessive (AR) mutations known to be present in members of a founder population and revealed surprisingly high carrier frequencies for many of these mutations. By utilizing the rich demographic, genetic, and phenotypic data available on these subjects and simulations in the exact pedigree that these individuals belong to, we show that the majority of mutations were most likely introduced into the population by a single founder and then drifted to the high carrier frequencies observed. We further show that although there is an increased incidence of AR diseases overall, the mean carrier burden is likely to be lower in the Hutterites than in the general population. Finally, on the basis of simulations, we predict the presence of 30 or more undiscovered recessive mutations among these subjects, and this would at least double the number of AR diseases that have been reported in this isolated population.


Figures

Figure 1
Figure 1
Results of Gene-Dropping Simulations (A–C) Simulated carrier frequency in the current population for each unique founder mutation. Box plots show the distribution (first quartile, median, and third quartile; dashed lines show minimum and maximum) of frequencies that each founder mutation reached in 100,000 trials under two models. The box plots are ordered in pairs from left to right by the number of descendants (shown along x axis beneath box plots) in the study sample from each founder. The first box plot in each pair shows the simulated frequencies under a neutral model, and the second box plot shows the simulated frequencies under a zero fitness (lethal) model. In the current population, the expected percentage of variants that are attributable to a given founder is shown above the box plots. In (B) and (C), each line represents the simulated frequency of (B) heterozygous carriers and (C) homozygotes for a neutral founder mutation in 25 year birth cohorts. For many founder mutations, the frequency of homozygotes increases over time, whereas there is no such pattern observed for the frequency of carriers. (D) Inbreeding coefficient by birth cohorts. The increase in consanguinity corresponds to the increase in the frequency of homozygotes in (C).
Figure 2
Figure 2
Observed Frequencies of Carriers, Carrier Couples, and Homozygotes over Time for 14 Disease Mutations Four CF carrier couples were excluded because they were previously ascertained for having children with CF. (A) Heterozygote frequencies in 25 year birth cohorts. The cohorts born before 1925 and after 2000 were excluded because of small sample sizes (n < 60). The black dashed line shows the cumulative carrier frequency for all 14 mutations. (B) Frequency of carrier couples. Both partners of one couple were carriers of DNAJC19 IVS3-1G>C and TECR p.Pro182Leu and are included twice in this figure. (C) Frequency of homozygotes born to each couple in (B). There are no homozygotes shown among the children of the ≥2000 marriage cohort because our study included children who were 6 years of age or older at the time of our last study in 2006–2009. Although we are aware that these families include children homozygous for SMA (n = 4) and CF (n = 2), we did not include them because we do not know the status of children born to all carrier couples. In addition, because infants homozygous for ZMPSTE24 c.1085dupT, causing RD, die within a few days of birth, homozygotes for this mutation would not have been included in our studies. However, family-history interviews with carrier couples and acquisition of medical records allowed us to identify homozygous children, who are included in this figure.
Figure 3
Figure 3
Distribution of Carrier Burden in 686 Subjects Who Were Genotyped for All 14 Mutations in This Study The mean carrier burden (defined as the number of mutations per individual) is 1.096 mutations. Black dots represent the theoretical expected number of subjects in each bin of mutations with a Poisson distribution with λ = 1.096.

Similar articles

Cited by

References

    1. Peltonen L. Molecular background of the Finnish disease heritage. Ann. Med. 1997;29:553–556. - PubMed
    1. Sheffield V.C., Stone E.M., Carmi R. Use of isolated inbred human populations for identification of disease genes. Trends Genet. 1998;14:391–396. - PubMed
    1. Arcos-Burgos M., Muenke M. Genetics of population isolates. Clin. Genet. 2002;61:233–247. - PubMed
    1. McKusick V.A. Genetic studies in American inbred populations with particular reference to the Old Order Amish. Isr. J. Med. Sci. 1973;9:1276–1284. - PubMed
    1. Ruiz-Perez V.L., Ide S.E., Strom T.M., Lorenz B., Wilson D., Woods K., King L., Francomano C., Freisinger P., Spranger S. Mutations in a new gene in Ellis-van Creveld syndrome and Weyers acrodental dysostosis. Nat. Genet. 2000;24:283–286. - PubMed

Publication types