. 2012 Sep 28;151(1):221-32.
doi: 10.1016/j.cell.2012.08.027. Epub 2012 Sep 11.

A temporal chromatin signature in human embryonic stem cells identifies regulators of cardiac development

Affiliations

A temporal chromatin signature in human embryonic stem cells identifies regulators of cardiac development

Sharon L Paige et al. Cell. .

Abstract

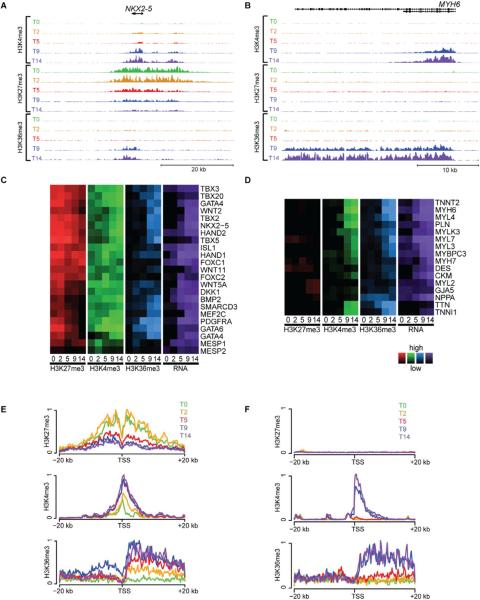
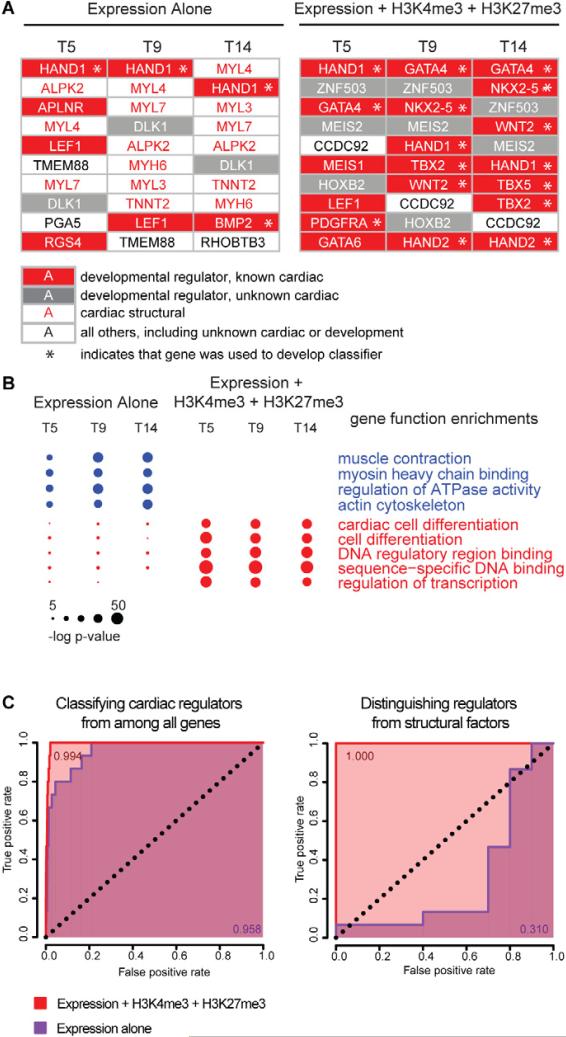
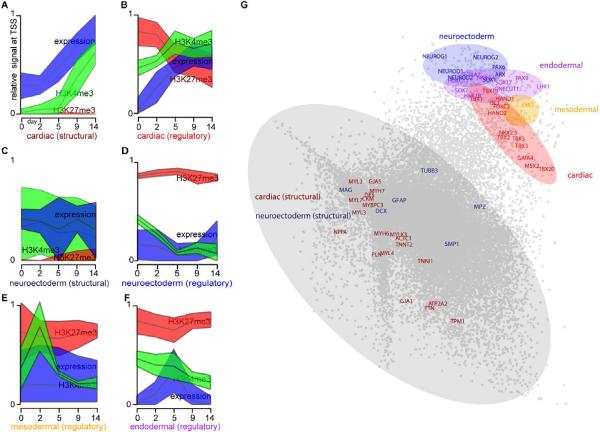
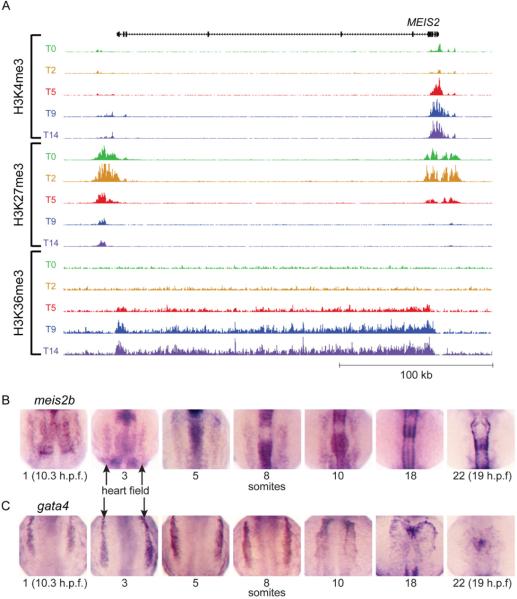
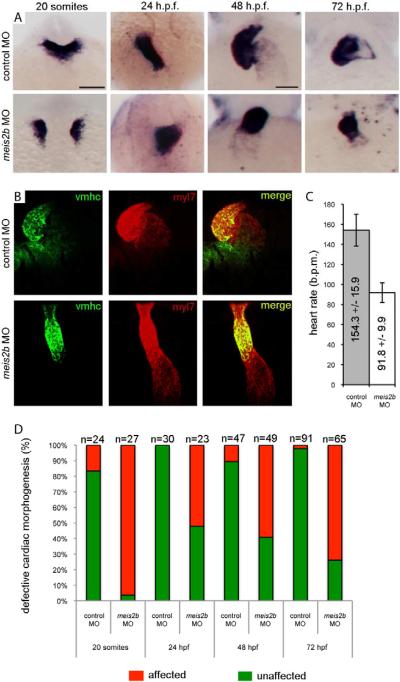
Directed differentiation of human embryonic stem cells (ESCs) into cardiovascular cells provides a model for studying molecular mechanisms of human cardiovascular development. Although it is known that chromatin modification patterns in ESCs differ markedly from those in lineage-committed progenitors and differentiated cells, the temporal dynamics of chromatin alterations during differentiation along a defined lineage have not been studied. We show that differentiation of human ESCs into cardiovascular cells is accompanied by programmed temporal alterations in chromatin structure that distinguish key regulators of cardiovascular development from other genes. We used this temporal chromatin signature to identify regulators of cardiac development, including the homeobox gene MEIS2. Using the zebrafish model, we demonstrate that MEIS2 is critical for proper heart tube formation and subsequent cardiac looping. Temporal chromatin signatures should be broadly applicable to other models of stem cell differentiation to identify regulators and provide key insights into major developmental decisions.


Figures

Figure 1
Figure 1. Key regulators of cardiac differentiation share a temporal chromatin signature
At five different time points of directed differentiation of human embryonic stem cells into cardiomyocytes (T0, 2, 5, 9 and 14), the levels of histone modifications H3K4me3 (activating), H3K27me3 (repressing) and H3K36me3 (transcribed) are shown within a ~50 kb region around (A) NKX2-5, a well-known regulator of cardiac differentiation (scales used: 1 to 250/150/50 tags per 150 bp, for H3K4me3/H3K27me3/H3K36me3) and (B) MYH6, a well-known structural component of cardiac cells (scales used: 1 to 500/100/50 tags per 150 bp, for H3K4me3/H3K27me3/H3K36me3). The relative levels of histone modifications (red, green and blue) and RNA expression (purple) are shown for (C) selected regulators of cardiac differentiation and (D) cardiac structural factors at all five time points. The averaged levels of epigenetic marks within ±20 kb of the TSS of (E) known regulators of cardiac differentiation and (F) known cardiac structural factors are plotted across all five time points (0, 2, 5, 9 14 = green, yellow, red, blue, purple). For key regulators of cardiac differentiation, levels of H3K4me3 and H3K36me3 increase during differentiation while H3K27me3 begins high and decreases, while H3K27 remains consistently low for cardiac structural factors. Note GATA4 is shown twice in panel (c) due to activation of two different promoters in our system. See Figure S3 for patterns found for other gene groups.
Figure 2
Figure 2. Accurate discrimination of key regulators of cardiac differentiation from other lineage-specific genes
(A) All genes were ranked by two different methods in order to identify key regulators of cardiac differentiation. They were ranked at days 5, 9 and 14 by a formula using either (left) RNA expression alone, or (right) one that accounts for levels of H3K4me3, H3K27me3 and RNA expression. At each time point the top 10 candidate regulators are depicted for the respective methods. Developmental regulators with known roles in cardiac differentiation are shown in white text on red background, developmental regulators with no currently-appreciated role in cardiac differentiation are shown in white text on grey background, and genes whose function pertains to the structure and function of heart cells with no known regulatory roles are shown in red text on white background. All other genes are shown in black text on white background. Genes that were used in the training set for identifying the chromatin + expression regulator signature are indicated with an asterisk. (B) The top 100 candidates provided by each ranked list (see Figure S4) were analyzed to determine the degree to which the lists were enriched in 11 key gene ontology functional categories. The size of each circle is proportional to the significance of the enrichment of genes with the indicated functional role within the given list of 100 genes at each time point/ method of ranking genes. Ranking genes using H3K4m3, H3K27me3 and RNA expression yields lists that are not contaminated by structural factors and are more enriched with known regulators of cardiac differentiation. (C) Classification based on H3K4me3, H3K27me3 and expression (red) is more specific and sensitive than classification based on expression alone (purple). Shown are ROC curves for the identification of key regulators of cardiac differentiation from among all genes (left panel) or among all genes involved in heart development (right panel). The expression-only classifier systematically misclassifies structural factors that are involved in heart function but do not regulate cardiac development (right panel), leading to a lower area under the curve when classifying key regulators from among all genes (left panel). The genes used to generate true-positives for cardiac regulatory and structural genes are given in Figure 1.
Figure 3
Figure 3. Temporal chromatin signatures enable cross-lineage identification of key regulatory factors
(A–F) The median levels (middle line) and 95% confidence intervals (shaded regions) of H3K27me3 (red), H3K4me3 (green) and RNA expression (blue) at each time point are depicted for several categories of genes: (A) genes involved in cardiac structure and function, (C) genes involved in neuroectoderm structure/function, and regulators of differentiation for (B) cardiac, (D) neuroectoderm, (E) mesoodermal and (F) endodermal cells. (A–F) were identically normalized, such that the lowest and highest values for each individual mark across all time points and gene groups were plotted as 0 and 1, respectively. (G) Using principle component analysis, the 15 dimensional data for each gene (5 time points * 3 measurements of chromatin and mRNA) were reduced to two dimensions, and a scatterplot is shown depicted the relative locations of each gene in the reduced-dimensional space. Genes involved in structure and function of cells are contained within the largest cluster (grey) distinct from the cluster containing key regulators of cellular fate: cardiac (red), neuroectoderm (blue), endoderm (purple) and mesoderm (yellow). Non-annotated genes within each of the colored domains have a high probability of having unappreciated roles as key regulators of cellular fate.
Figure 4
Figure 4. MEIS2 chromatin modifications during hESC differentiation and expression in developing zebrafish embryos resembles other regulators of cardiac development
(A) The temporal pattern of epigenetic marks at the MEIS2 locus is similar to that of other regulators of cardiac development shown in Figure 1 (scales used: 1 to 250/150/25 tags per 150 bp, for H3K4me3/H3K27me3/H3K36me3). (B) Zebrafish meis2b expression are shown for developing embryos at the 1, 3, 5, 8, 10, 18 and 22 somite stages, showing (C) similar expression patterns within the bilateral heart fields (arrows) to gata4 through the 10 somite stage. By 18 somites, meis2b is no longer expressed in the cardiac mesoderm whereas gata4 maintains expression.
Figure 5
Figure 5. meis2b is required for cardiac morphogenesis
(A) Expression of myl7 at 19 h.p.f., 24 h.p.f, 48 h.p.f. and 72 h.p.f. in control-MO (top row) versus meis2b-MO (bottom row) injected zebrafish embryos. Dorsal view, anterior is up in 20 somite and 24 h.p.f. embryos. Ventral view, anterior up in 48 h.p.f. and 72 h.p.f. embryos. At 19 h.p.f., meis2b-MO injected embryos display defects in fusion of the myl7+ cardiac progenitors at the midline compared with control-MO injected embryos. By 24 h.p.f., the heart tube has formed in meis2b morphants but displays aberrant cardiac morphogenesis and is either sitting at the midline or moving down the right side of the embryo, compared with the control-MO injected embryos where normal heart development proceeds with the heart tube emerging from under the head, down the left side of the embryo. At 48 and 72 h.p.f., control MO injected embryos display normal cardiac looping, while meis2b-MO injected embryos' hearts have not looped. (B) This failure of cardiac looping in meis2b-MO injected embryos is further evident in vmhc (green) and myl7 (red) double fluorescent in situs at 48 h.p.f.. (C) Heart rate is significantly reduced in meis2b-MO injected embryos compared with control-MO injected embryos at 72 h.p.f. (b.p.m. = beats per minute) Mean heart rate +/− s.d. is shown, n=10. P = 4 ×10⁻⁹ (Student's t-test, two-tailed). (D) Percentages of embryos displaying the depicted phenotypes. Scale bar in A (top left), 100 μm. Scale bar in A (top 3rd from the left), 50 μm. See also Figure S5.

Comment in

References

    1. Azuara V, Perry P, Sauer S, Spivakov M, Jørgensen HF, John RM, Gouti M, Casanova M, Warnes G, Merkenschlager M, et al. Chromatin signatures of pluripotent cell lines. Nat Cell Biol. 2006;8:532–538. - PubMed
    1. Bannister AJ, Schneider R, Myers FA, Thorne AW, Crane-Robinson C, Kouzarides T. Spatial distribution of di- and tri-methyl lysine 36 of histone H3 at active genes. J Biol Chem. 2005;280:17732–17736. - PubMed
    1. Bernstein BE, Mikkelsen TS, Xie X, Kamal M, Huebert DJ, Cuff J, Fry B, Meissner A, Wernig M, Plath K, et al. A bivalent chromatin structure marks key developmental genes in embryonic stem cells. Cell. 2006;125:315–326. - PubMed
    1. Boyer LA, Plath K, Zeitlinger J, Brambrink T, Medeiros LA, Lee TI, Levine SS, Wernig M, Tajonar A, Ray MK, et al. Polycomb complexes repress developmental regulators in murine embryonic stem cells. Nature. 2006;441:349–353. - PubMed
    1. Bu L, Jiang X, Martin-Puig S, Caron L, Zhu S, Shao Y, Roberts DJ, Huang PL, Domian IJ, Chien KR. Human ISL1 heart progenitors generate diverse multipotent cardiovascular cell lineages. Nature. 2009;460:113–117. - PubMed

Publication types

Associated data