. 2012 Sep 21;37(3):511-23.
doi: 10.1016/j.immuni.2012.06.014. Epub 2012 Sep 13.

The cytokines interleukin 27 and interferon-γ promote distinct Treg cell populations required to limit infection-induced pathology

Affiliations

The cytokines interleukin 27 and interferon-γ promote distinct Treg cell populations required to limit infection-induced pathology

Aisling O'Hara Hall et al. Immunity. .

Abstract

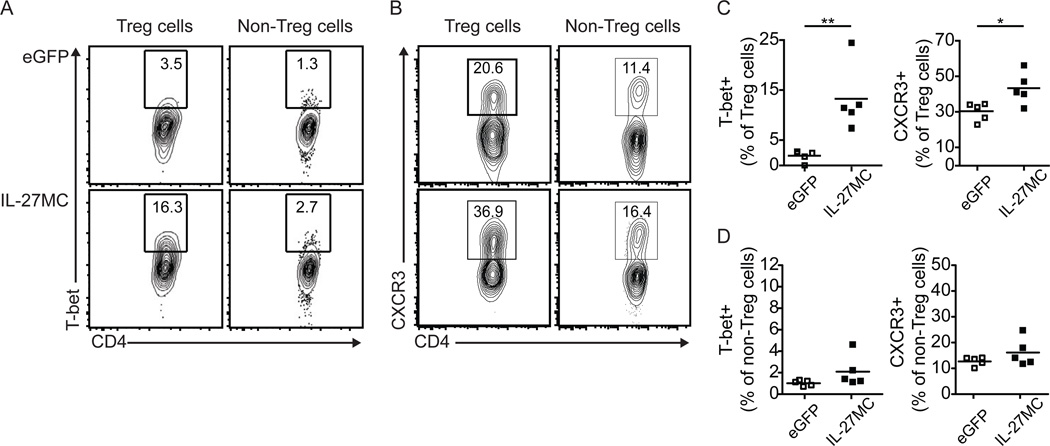
Interferon-γ (IFN-γ) promotes a population of T-bet(+) CXCR3(+) regulatory T (Treg) cells that limit T helper 1 (Th1) cell-mediated pathology. Our studies demonstrate that interleukin-27 (IL-27) also promoted expression of T-bet and CXCR3 in Treg cells. During infection with Toxoplasma gondii, a similar population emerged that limited T cell responses and was dependent on IFN-γ in the periphery but on IL-27 at mucosal sites. Transfer of Treg cells ameliorated the infection-induced pathology observed in Il27(-/-) mice, and this was dependent on their ability to produce IL-10. Microarray analysis revealed that Treg cells exposed to either IFN-γ or IL-27 have distinct transcriptional profiles. Thus, IFN-γ and IL-27 have different roles in Treg cell biology and IL-27 is a key cytokine that promotes the development of Treg cells specialized to control Th1 cell-mediated immunity at local sites of inflammation.


Figures

Figure 1
Figure 1. IL-27 treatment of Treg cells induces STAT1 and STAT3 phosphorylation and the expansion of a STAT1-dependent T-bet+ CXCR3+ population
(A and B) Natural Treg (nTreg) cells harvested from naïve mice and (B) inducible Treg (iTreg) cells generated in vitro (as described in the Experimental Procedures) were stimulated with IL-27 or media alone and phosphorylated STAT1 and STAT3 were measured by flow cytometry. Plots depict the mean percentage ± standard error of the mean (SEM) of Treg cells (gated on live/dead-, CD4+, Foxp3+ cells) expressing pSTAT1 or pSTAT3. (C) NTreg cells or iTreg cells were cultured in the presence of neutralizing antibodies to IFN-γ and IL-4 (neutral conditions) and in the presence or absence of IL-27. Following 48 hours of culture, the expression of T-bet and CXCR3 was measured by flow cytometry. Plots depict the percentage of positive Treg cells (number inside gate) and the geometric mean channel fluorescence (MFI) to the left of the gate. (D) ITreg cells were cultured in the presence or absence of IL-27 for 72 hours and subsequently re-stimulated with PMA/ionomycin in the presence of BFA and monensin Golgi inhibitors for 5 hours. The production of IFN-γ and IL-10 by iTreg cells was measured by flow cytometry. (E) ITreg cells were generated from wildtype (WT) and Stat1−/− deficient T cells in the presence or absence of IL-27 for 72 hours. Plots depict the mean percentage ± SEM of Treg cells that expressed T-bet or CXCR3. (F) ITreg cells were generated from WT, Tbx21−/−, and CD4-Cre × Eomesfl/fl mice in the presence or absence of IL-27 for 48 hours. The percentage (inside plot) and MFI (outside plot) of Treg cells expressing CXCR3 was measured by flow cytometry. All plots are representative of three independent experiments with 3 replicates per group. See also Figure S1.
Figure 2
Figure 2. Ectopic expression of IL-27 increases Treg cell expression of T-bet and CXCR3
(A–D) WT mice were injected by hydrodynamic tail vein delivery control (eGFP) or IL-27 minicircles (IL-27MC) and examined 4 weeks after treatment. (A and B) T-bet (A) and CXCR3 (B) expression by Treg cells (gated on live/dead-, CD4+, Foxp3+ cells) and non-Treg T cells (gated on live/dead-, CD4+, Foxp3- cells) isolated from the spleen were measured by flow cytometry. (C and D) The percentage of Treg (C) and non-Treg (D) cell expression of T-bet and CXCR3 from individual mice. Data are representative of two independent experiments with five mice per group, * p < 0.05, ** p < 0.01. See also Figure S2.
Figure 3
Figure 3. Treg cells have a Th1 phenotype and suppress effector T cell IFN-γ-production during toxoplasmosis
(A and B) Treg cells (gated on live/dead-, TCR-β+, CD4+, Foxp3+) were isolated from the lamina propria (LPL) of naïve or T. gondii infected WT mice and analyzed for their expression of IFN-γ following re-stimulation with PMA/ionomycin in the presence of Golgi inhibitors (A) or directly ex vivo without re-stimulation from Vert-X IL-10-eGFP reporter mice (B). (C) LPL Treg cells from WT T. gondii infected mice co-express IFN-γ and IL-10 following re-stimulation with PMA/ionomycin in the presence of Golgi inhibitors. (D) T-bet and CXCR3 expression by Treg cells isolated from the mesenteric lymph nodes (mLN) of naïve (shaded histogram) or T. gondii infected mice (solid line). (E) The mean percentage ± SEM of T-bet and CXCR3 expressing Treg cells in the mLN of naïve and infected mice are depicted. Data are representative of > 5 experiments, n=5, * p < 0.05. (F) Cells were isolated from the spleen and LPL of naïve and infected mice and incubated with Golgi inhibitors for 6–8 hours. IL-12p40 and IL-27p28 expression was measured in live/dead-, CD19-, B220-, NK1.1-, CD3- cells that are CD11b+ CD11cint (top panel) or CD11chi MHC Class IIhi (bottom panel). (G) WT and DEREG mice were infected with T. gondii and treated with diphtheria toxin (DT) on days 2–9 of infection. On day 9 post-infection, T cells were isolated from the lamina propria and spleen by CD90.2 expression and cultured with media alone, dendritic cells, or dendritic cells pulsed with soluble Toxoplasma antigen (STAg). Treg cells (gated on live/dead-, TCR-β+, CD4+, Foxp3+ cells) were stained for T-bet and IFN-γ expression. These data are representative of ≥3 experiments, n ≥ 3 per experiment. See also Figure S3.
Figure 4
Figure 4. Th1 Treg cell development during T. gondii infection is IL-27-dependent and iTreg cells can rescue acute pathology in Il27−/− mice
(A–D) Cells were isolated from the spleen, mLN, Peyer’s patches, and LPL of naïve and T. gondii infected WT and Il27−/− mice. T-bet and CXCR3 expression were measured on non-Treg CD4+ T cells (gated on live/dead-, TCR-β+, CD4+, Foxp3- cells) (A) and Treg cells (gated on live/dead-, TCR-β+, CD4+, Foxp3+ cells) (B), Peyer’s patches shown. The MFI of Treg cell T-bet (C) and CXCR3 (D) expression from individual mice are shown for all tissues. Data are representative of > 5 experiments, * p < 0.05, ** p < 0.01, ***p < 0.001. (E) Levels of IL-27p28, IL-12p40, and IFN-γ were measured in the serum of WT and Il27−/− mice on day 9 post-infection by ELISA. (F) WT and Il27−/− mice were infected i.p. with T. gondii and received PBS or 2–4×10⁶ WT Treg cells cultured in neutral conditions (2 experiments, n=5), WT Treg cells cultured with IL-27 (Th1 Treg cells) (4 experiments, n=10), or Il10−/− Treg cells cultured with IL-27 (2 experiments, n=8). Mice received Tregs on day 4, 7, and 10 post-infection. See also Figure S4.
Figure 5
Figure 5. IFN-γ promotes the Th1 Treg cell phenotype in the periphery, but not sites of inflammation
(A–D) Mice were infected with T. gondii and treated with anti-IFN-γ or control antibodies (rat IgG) on day 3, 5, 7, and 9 post-infection. (A) On day 10, cells were isolated from the spleen and LPL of naïve and infected mice and T-bet and CXCR3 expression by Treg cells were measured by flow cytometry (gated on live/dead-, TCR-β+, CD4+, Foxp3+ cells). (B) Plots depict the MFI of T-bet and CXCR3 expression by Treg cells (presented as mean ± SEM), * p < 0.05, ** p < 0.01. (C) Spleen and LPL cells were re-stimulated with PMA/ionomycin in the presence of Golgi inhibitors and analyzed for IL-10 and IFN-γ expression within Treg cells. (D) Plots depict the frequency of Treg cells expressing IL-10 and IFN-γ following re-stimulation. Plots are representative of 2 experiments, n=5. See also Figure S5.
Figure 6
Figure 6. IFN-γ and IL-27 have distinct effects on Treg cells
(A) NTreg cells were isolated from naïve mice and treated with media alone, IFN-γ, or IL-27. Levels of pSTAT1, 3, and pSTAT5 were measured over time by flow cytometry. Results were normalized to media control. Plots are representative of 2 experiments, n=2. (B) ITreg cells were generated under neutral conditions for seven days and stimulated as in (A). (C–E) ITreg cells were generated under neutral conditions or with IL-27 or IFN-γ (without blocking antibodies to IFN-γ and IL-4) and T-bet and CXCR3 expression was measured on day 5 (C) in replicate cultures (D) and over time (E). Plots are representative of three experiments, ** p < 0.01, ***p < 0.001. (F and G) NTreg cells were isolated and cultured under neutral conditions or treated with IFN-γ or IL-27 and monitored for T-bet and CXCR3 expression on day 5 of culture (F) and over time (G). Plots are representative of 3 independent experiments. See also Figure S6.
Figure 7
Figure 7. IL-27 induces a gene expression profile in Treg cells that is distinct from the profile induced by IFN-γ
(A–F) ITreg cells were cultured under neutral conditions for seven days, harvested, and then exposed to neutral, IL-27 or IFN-γ Treg culture conditions for 10 or 48 hours. mRNA was isolated and microarray analysis was performed as described in the experimental procedures. Hierarchical clustering analysis was performed on genes that were differentially regulated 1.5 fold or greater, compared to neutral conditions, by either IL27 or IFN-γ after 10hr or 48hr culture, p < 0.05. Three clusters of genes are shown as heatmaps. (A) Genes down-regulated most strongly by IL-27; (C) genes upregulated by IL-27 but not IFN-γ; and (E) genes induced by both cytokines, but to a greater degree by IL-27. Heatmap color indicates log2 expression value. Clusters are also represented by line graphs showing the fold changes in gene expression (B, D, F). Each line shows gene expression changes for a single gene. Several genes had more dramatic changes in expression at either the 10 hr or 48 hr timepoints and thus were grouped as sub-group 1 “early” and sub-group 2 “late”, respectively. See also Figure S6.

Comment in

References

    1. Aliberti J, Serhan C, Sher A. Parasite-induced lipoxin A4 is an endogenous regulator of IL-12 production and immunopathology in Toxoplasma gondii infection. J. Exp. Med. 2002;196:1253–1262. - PMC - PubMed
    1. Apostolou I, Verginis P, Kretschmer K, Polansky J, Huhn J, von Boehmer H. Peripherally induced Treg: mode, stability, and role in specific tolerance. J. Clin. Immunol. 2008;28:619–624. - PubMed
    1. Bayer AL, Yu A, Malek TR. Function of the IL-2R for thymic and peripheral CD4+CD25+ Foxp3+ T regulatory cells. J. Immunol. 2007;178:4062–4071. - PubMed
    1. Bhadra R, Gigley JP, Weiss LM, Khan IA. Control of Toxoplasma reactivation by rescue of dysfunctional CD8+ T-cell response via PD-1-PDL-1 blockade [Immunology] Proceedings of the National Academy of Sciences. 2011;108:9196–9201. - PMC - PubMed
    1. Buzoni-Gatel D, Debbabi H, Mennechet FJ, Martin V, Lepage AC, Schwartzman JD, Kasper LH. Murine ileitis after intracellular parasite infection is controlled by TGF-beta-producing intraepithelial lymphocytes. Gastroenterology. 2001;120:914–924. - PubMed

Publication types

MeSH terms

Associated data