. 2012 Sep 21;37(3):574-87.
doi: 10.1016/j.immuni.2012.06.016. Epub 2012 Sep 13.

Adipose tissue invariant NKT cells protect against diet-induced obesity and metabolic disorder through regulatory cytokine production

Affiliations

Adipose tissue invariant NKT cells protect against diet-induced obesity and metabolic disorder through regulatory cytokine production

Lydia Lynch et al. Immunity. .

Abstract

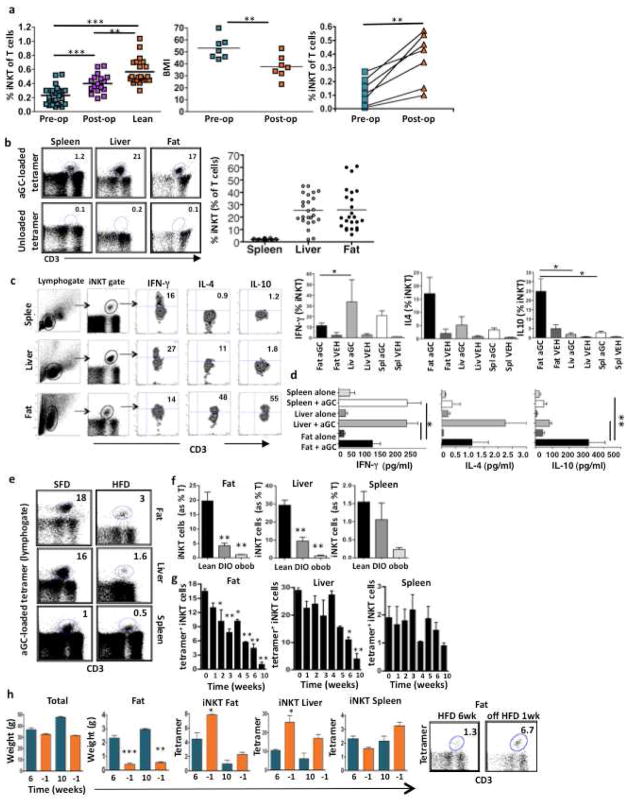
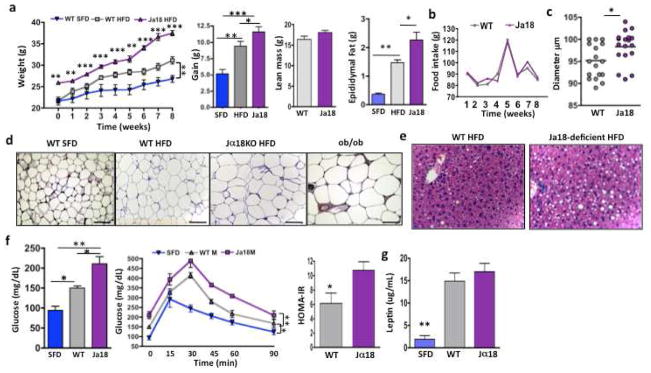
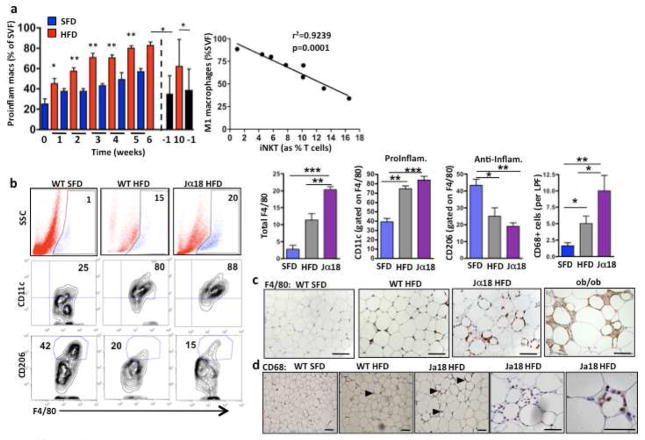
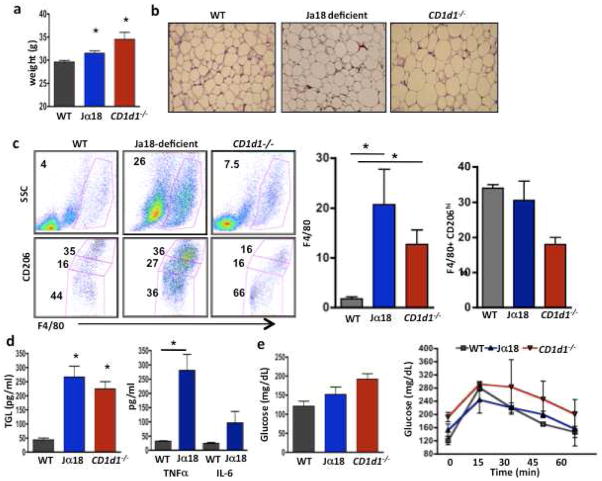
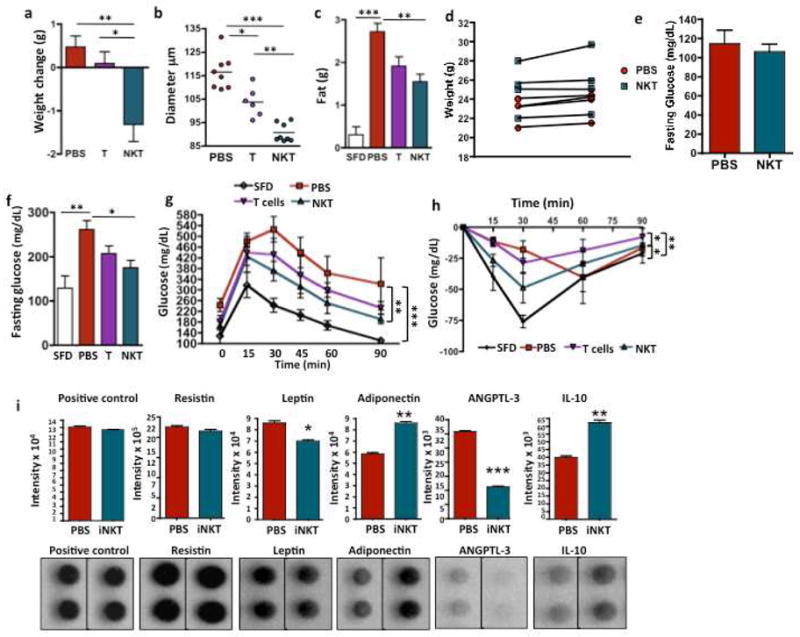
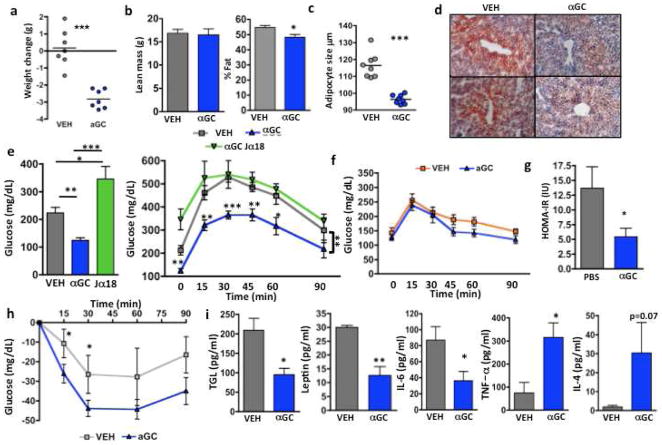
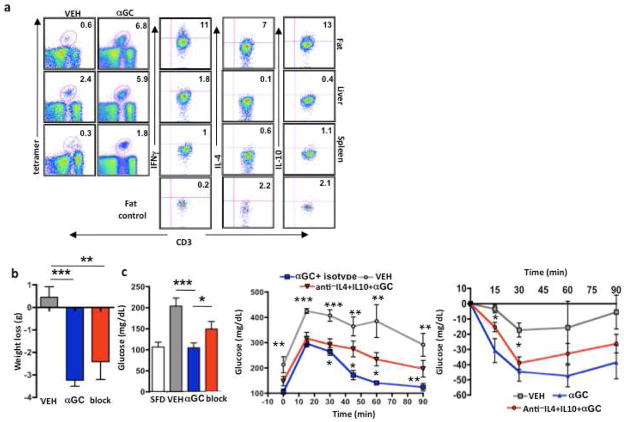
Invariant natural killer T (iNKT) cells are evolutionarily conserved innate T cells that influence inflammatory responses. We have shown that iNKT cells, previously thought to be rare in humans, were highly enriched in human and murine adipose tissue, and that as adipose tissue expanded in obesity, iNKT cells were depleted, correlating with proinflammatory macrophage infiltration. iNKT cell numbers were restored in mice and humans after weight loss. Mice lacking iNKT cells had enhanced weight gain, larger adipocytes, fatty livers, and insulin resistance on a high-fat diet. Adoptive transfer of iNKT cells into obese mice or in vivo activation of iNKT cells via their lipid ligand, alpha-galactocylceramide, decreased body fat, triglyceride levels, leptin, and fatty liver and improved insulin sensitivity through anti-inflammatory cytokine production by adipose-derived iNKT cells. This finding highlights the potential of iNKT cell-targeted therapies, previously proven to be safe in humans, in the management of obesity and its consequences.


Conflict of interest statement

The other authors have no conflicting financial interests.

Figures

Figure 1
Figure 1. iNKT cells are depleted in obesity, but are restored following weight loss in mice and humans
(a) iNKT cells (expressed as a % of T cells) in peripheral blood of obese patients before bariatric surgery (pre-op) (BMI>50, n=26) compared to lean age-matched controls (BMI= 20–25, n=22) and unmatched patients 18 months after surgery (postop) (n=18, p=0.0002; Mann Whitney test). 7 patients were analyzed both pre- and post-bariatric surgery. Middle: BMI of patients before and 18 months post-op.. Right: Peripheral iNKT cell levels in each patient (n=7, paired t-test). (b) Left: iNKT (αGC loaded tetramer+) as % of T cells (top) and unloaded CD1d tetramer negative control (bottom) in a representative sample of matched spleen, liver and fat. Right: iNKT cells (expressed as a % of T cells) in each individual wt spleen, liver and fat from 6–10 week old mice (n=24). (c) Left: Representative flow cytometric plots showing percentage of iNKT cells producing each cytokine intracellularly following αGC injection (representative of n=4), Right: Concentrations of intracellular cytokines production by iNKT cells, mean + s.d. (n=4). (d) iNKT cytokine production after in vitro stimulation with αGC-loaded CD1d transfected C1R cells (3 independent experiments performed in duplicate). (e) Representative dot plots of iNKT cell (αGC-loaded tetramer+) numbers in matched fat, liver and spleen from 10–14 week old mice on a SFD or HFD (representative of 11 experiments). (f) iNKT cells in fat, liver and spleen from mice on HFD for 8 weeks (n=11) or ob/ob mice (n=3) compared to age-matched mice on SFD (n=11). (g) iNKT cell numbers measured each week on HFD in matched fat, liver and spleen (n=4 per week). See also Fig. S2. (h) Mice were removed from HFD after 6 weeks (n=4) and after 10 weeks (n=4). Graphs show overall weight (total) and fat pad weight during HFD (green bars) and after removal from HFD (orange bars) after 6 weeks (p=0.0007) or 10 weeks (p=0.001). iNKT numbers in fat, liver and spleen after removal from HFD. Graph show mean+ s.d. n=4. *p<0.05, **, p<0.01, ***p<0.0001
Figure 2
Figure 2. Impact of iNKT cell deficiency on weight gain, glucose tolerance, adipocyte size and number and fat accumulation in liver
(a) Weight of Jα18−/− and wt mice on commencement of and during 8 weeks of HFD compared to wt on SFD (n=4 per group per week). Overall weight gain afer 8 weeks of HFD. Lean mass and epididymal fat pad weight of wt and Jα18−/− mice on HFD, wt mice on SFD are shown for comparison. (b) HFD food intake of wt and Jα18-deficient mice. (c) Adipocyte diameter was measured on osmium-fixed adipocytes with a particle counter. Adipocyte size from Jα18−/− and wt mice on HFD (4 samples per mouse, 4 mice per group). (d) Histology of adipocytes from epididymal fat. Adipocyte size from wt mice on SFD, wt mice and HFD and Jα18−/− mice on HFD. ob/ob mice also shown for comparison. Scale bars, 100μm. (e) Histology of fat infiltration in liver of wt and Jα18−/− mice on HFD (Representative of 4 individual experiments). (f) Fasting glucose (left), glucose tolerance (middle) and insulin resistance (right) in wt on SFD, wt on HFD, and Jα18-deficient mice on HFD for 6 weeks (n=4 per group, t tests, and 2 way ANOVA with Tukey for glucose tolerance tests). Insulin resistance as measured by HOMA-IR (t test). (g) Serum leptin levels in wt and Jα18-deficient mice on HFD compared to wt on SFD (n=4 per group, ANOVA). Graphs show mean+ s.d. *p<0.05, **, p<0.01, ***p<0.0001
Figure 3
Figure 3. The relationship between iNKT cells and macrophages
(a) Left, Proinflammatory macrophages (Pro-inflam Macs; F4/80+ CD11c+ MMR+) levels in fat (as % stromovascular fraction (SVF) of wt mice fed HFD (red) or SFD (blue) for 10 weeks. Dashed line shows when HFD was replaced with SFD (black). Right, Correlation between iNKT cell levels and macrophage number in fat, Pearson r= −0.9612, p=0.0001. (b) Left: Representative dot plots of % F4/80+ total macrophages per fat pad (top), and the % macrophages that are CD11c+ (proinflammatory) (middle) and the % macrophages that are CD206+ (anti-inflammatory) (bottom) in wt SFD, wt HFD and Jα18-deficient on HFD. Right: Levels and phenotypes of macrophages from individual mice groups (n=4 mice per group), including number of CD68+ macrophages as measured by immunohistochemistry (n=20 low power field (LPF) per group). (c) Immunohistochemical staining of F4/80+ macrophages in fat from wt on SFD, wt on HFD and Jα18−/− mice on HFD, and ob/ob mice on SFD (Representative of 4 mice per group). (d) Immunohistochemical staining of CD68+ M1 macrophages in fat from wt on SFD, and wt and Jα18-deficient on HFD (representative of 4 mice per group). Scale bars, 100 μm. *p<0.05, **, p<0.01, ***p<0.0001
Figure 4
Figure 4. iNKT null mice have more pro-inflammatory cytokines and macrophages on a SFD
(a) Weight of wt, Jα18−/−, and CD1d1−/− mice fed SFD ad lib until 20 weeks of age (n=3 per group, one-way ANOVA with post-hoc Tukey). (b) Adipocyte size in wt, Jα18-deficient and CD1d1−/− mice on SFD (representative of 3 mice per group). (c) Macrophage level and phenotype in the 3 mice groups on SFD. Left top, total macrophages, and bottom, M2 (CD206+) macrophages, CD206 hi (top gate), CD206lo (middle gate) and CD206 (bottom gate). (d) Fasting serum triglyceride (TGL) concentration in the 3 groups (n=3, all one-way ANOVA with post-hoc Tukey). Serum TNFα and IL-6 concentration in wt and Jα18−/− mice on SFD (n=3, t test), CD1d1−/− mice not tested. (e) Fasting glucose and glucose tolerance of 20 week old wt, Jα18−/−, and CD1d1−/− mice on SFD. Graphs show mean+ s.d. *p<0.05, **, p<0.01, ***p<0.0001.
Figure 5
Figure 5. Adoptive transfer of iNKT cells protect from weight gain and adipocyte hypertrophy and reverse obesity-associated metabolic disorder
Wt iNKT cells (>95% pure), iNKT cell-depleted T cells (T), or no treatment (PBS) control were injected ip into 18–20 wk old diet-induced obese mice on HFD for 12 weeks which continued on HFD for 4 days. (a) Difference in weight pre-and 4 days post-adoptive transfer of mice that received iNKT cells (n=10) or PBS (n=6) or T cells (n=6). (b) Adipocyte diameter from obese mice that received iNKT cells vs T cells or PBS control, 2 samples per mouse, n=4 for PBS and NKT, n=3 for T cells, ANOVA with Tukey). (c) Epididymal fat weight after iNKT transfer (n=10) compared to PBS (n=6) or T cell transfer (n=6) and wt on SFD as comparison (n=4). (d) Weight change and (e) fasting glucose in lean wt mice that relieved NKT cell transfer. (f) Fasting glucose (ANOVA) and (g) glucose tolerance following iNKT (n=8) transfer compared to PBS (n=4) or T cell transfer (n=4) with wt on SFD for comparison (n=4, 2 way ANOVA) (h) Insulin tolerance test in obese mice was measured 4 days post transfer of iNKT cells (n=4), PBS (n=4), T cells or wt on SFD (n=3) (2 way ANOVA with Tukey post-hoc). (i) Following adoptive transfer of iNKT cells for 3 days, adpose tissue was harvested and cultured. Production of resistin, leptin, adiponectin, ANGPTL3 and IL-10 were measured by protein array (n=2 of 2 pooled mice each), Graphs show mean+ s.d. *p<0.05, **, p<0.01, ***p<0.0001.
Figure 6
Figure 6. αGC treatment reverses obesity-associated metabolic disorders
(a,b) Effect of αGC treatment on weight gain and adipocytes. (a) Difference in weights before and 4 days after αGC or vehicle (VEH) treatment. (n=7 per group, t test). (b) Lean mass and % body fat measured by DEXA following αGC treatment (n=5, t test). (c) Adipocyte size following αGC treatment (2 samples per mouse, n=4 mice, t test). (d) Oil Red O staining in liver samples from wt obese mice 4 days post αGC injection. 2 representative images per treatment (representing 5 mice per group). (e) Fasting glucose and GTT of wt obese mice 4 days post αGC injection (n=5, fasting glucose: t test; GTT: 2 way ANOVA with post hoc shown; Area under curve ***p=0.0007). (f) Glucose tolerance test following αGC treatment into lean wt mice on SFD (n=4 per group). (g) Insulin resistance as measured by HOMA-IR and (h) insulin tolerance test following aGC treatment (n=4). (i) Circulating triglyceride (TGL), leptin IL-6, TNF-a, and IL-4 following aGC treatment (n=5 each, all t tests. Graphs show mean+ s.d. *p<0.05, **, p<0.01, ***p<0.0001.
Figure 7
Figure 7. αGC treatment expands adipose iNKT cells and activates their IL-4 and IL-10 production resulting in improved metabolic health
(a) Left: iNKT cell levels in adipose tissue, liver and spleen at 4 days post-αGC injection. Right: IFNγ, IL-4 and IL-10 production by iNKT cells from each organ post-activation. Quadrant percentages represent cytokine production by iNKT cells after subtraction of control (control for fat shown on bottom row). (b) Obese mice received neutralizing IL-4 and IL-10 (n=7) antibodies before αGC treatment. Weight loss post treatment with or without neutralizing antibodies. (c) Glucose tolerance test and insulin resistance test in obese mice where IL-10 and IL-4 were neutralized prior to αGC (n=7, 2-way ANOVA and t test). *p<0.05, **, p<0.01, ***p<0.0001.

Comment in

References

    1. Bendelac A, Savage PB, Teyton L. The biology of NKT cells. Annu Rev Immunol. 2007;25:297–336. - PubMed
    1. Berzins SP, Smyth MJ, Baxter AG. Presumed guilty: natural killer T cell defects and human disease. Nat Rev Immunol. 11:131–142. - PubMed
    1. Brigl M, Brenner MB. CD1: antigen presentation and T cell function. Annu Rev Immunol. 2004;22:817–890. - PubMed
    1. Cerundolo V, Silk JD, Masri SH, Salio M. Harnessing invariant NKT cells in vaccination strategies. Nat Rev Immunol. 2009;9:28–38. - PubMed
    1. Dalmas E, Clement K, Guerre-Millo M. Defining macrophage phenotype and function in adipose tissue. Trends Immunol 2011 - PubMed

Publication types

MeSH terms