. 2012 Sep 28;151(1):206-20.
doi: 10.1016/j.cell.2012.07.035. Epub 2012 Sep 12.

Dynamic and coordinated epigenetic regulation of developmental transitions in the cardiac lineage

Affiliations

Dynamic and coordinated epigenetic regulation of developmental transitions in the cardiac lineage

Joseph A Wamstad et al. Cell. .

Abstract

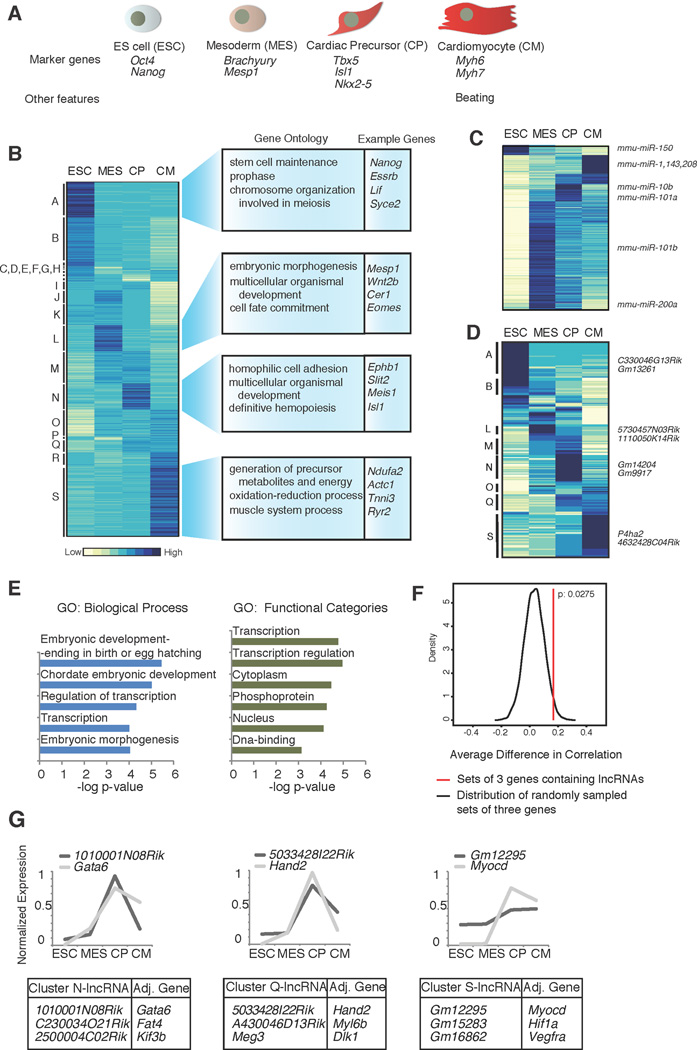
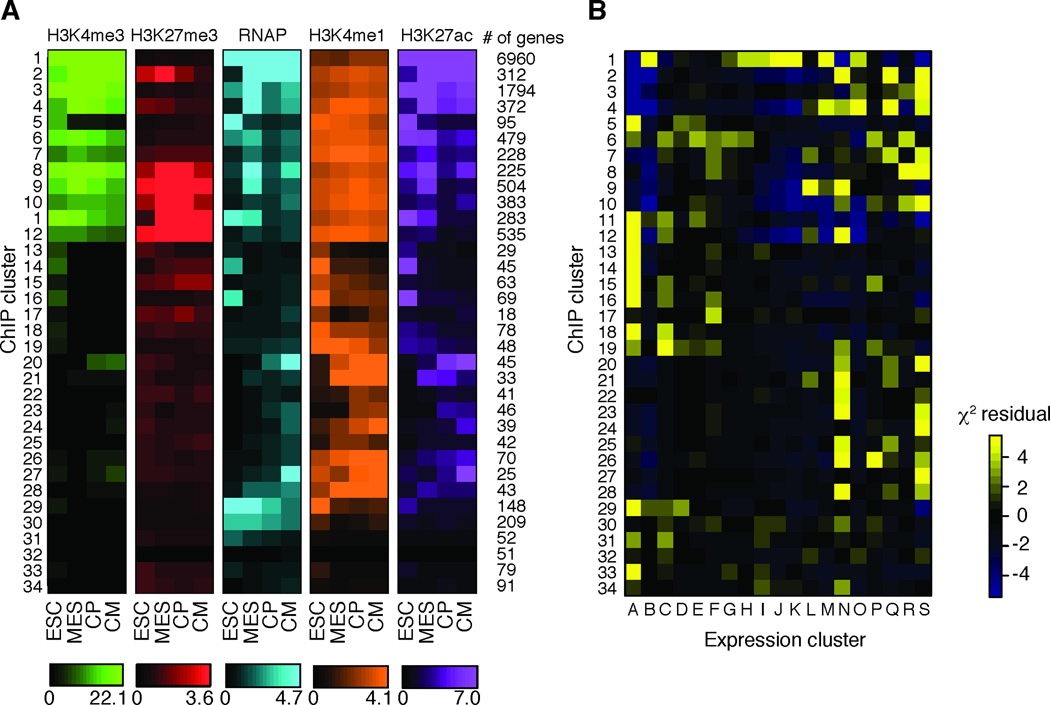
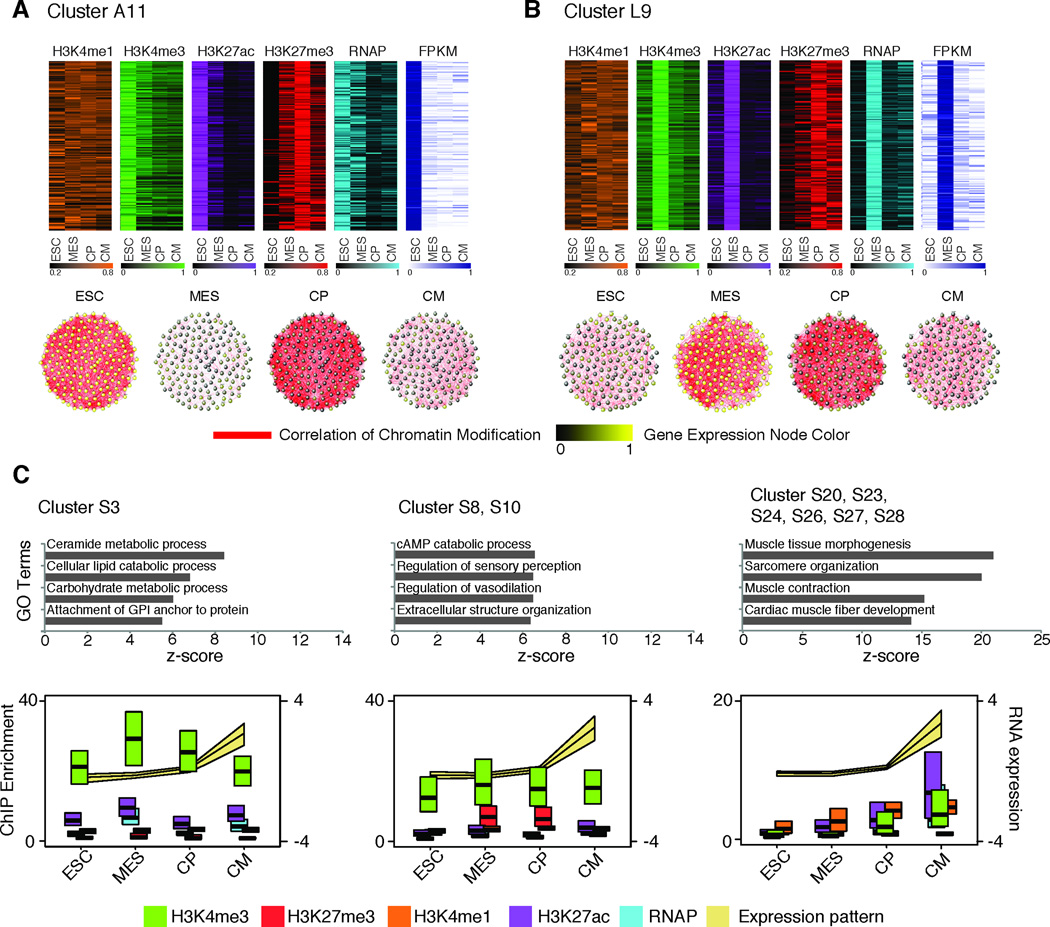
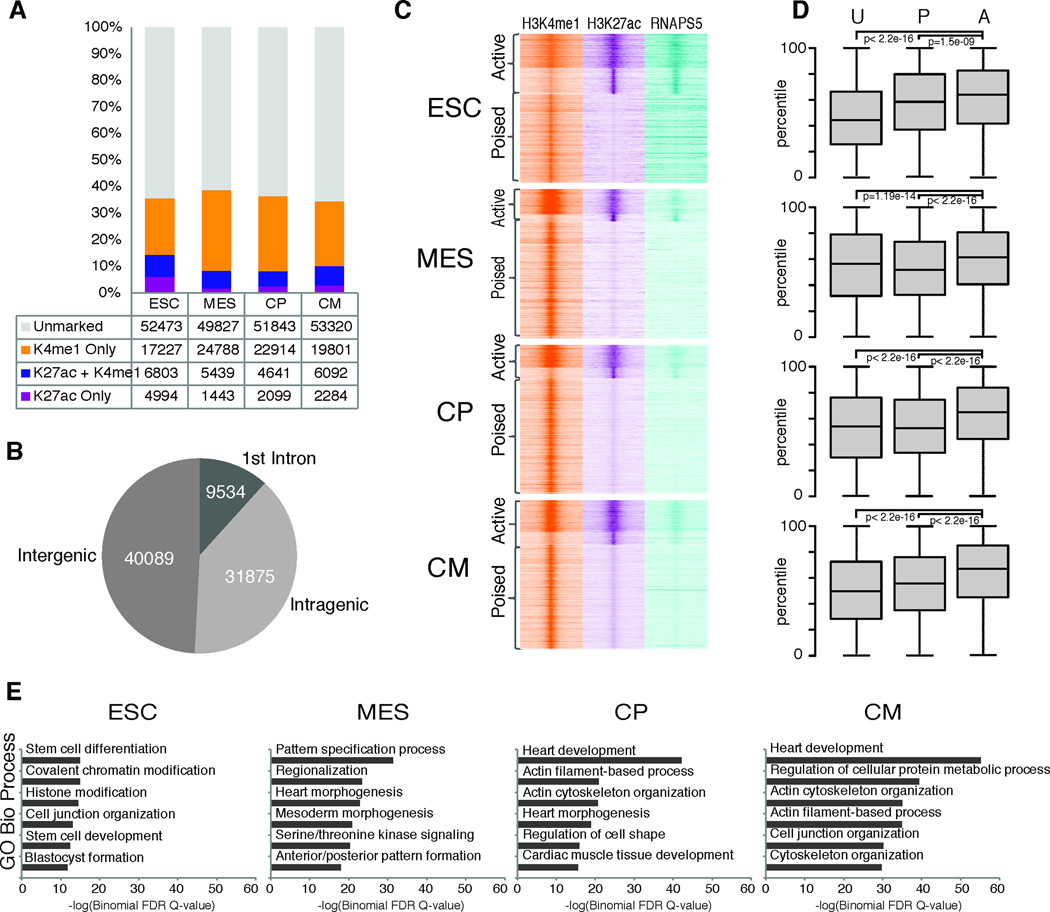
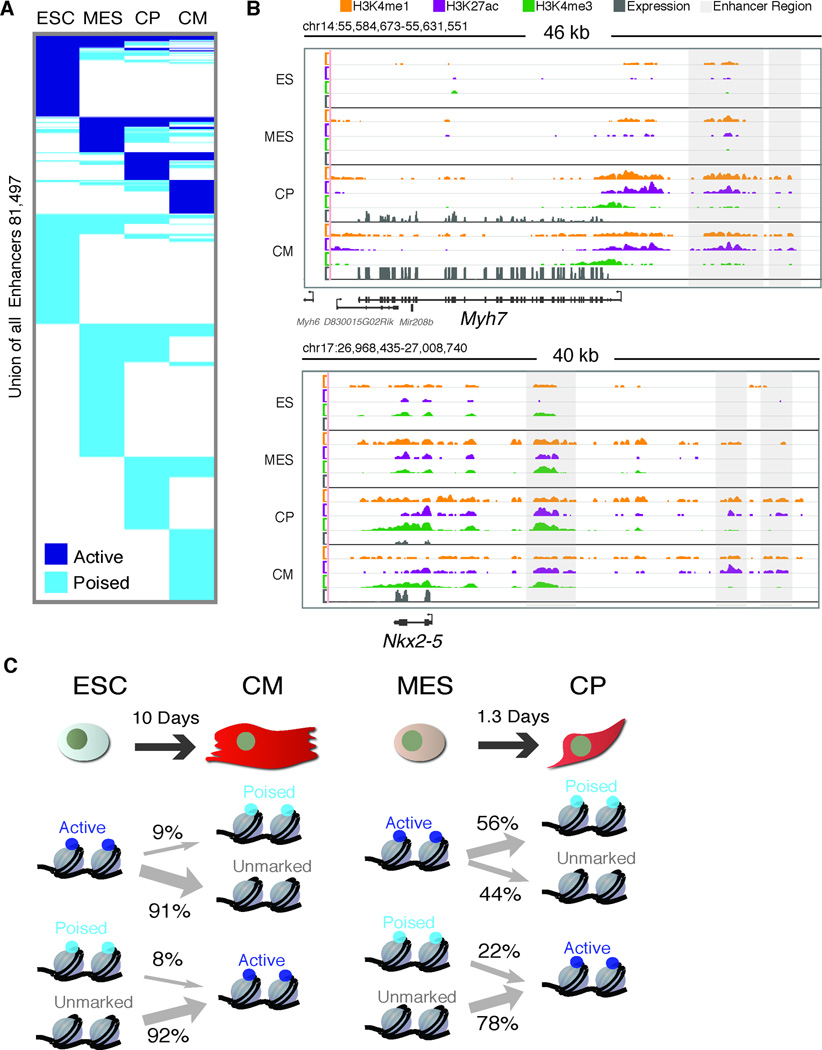
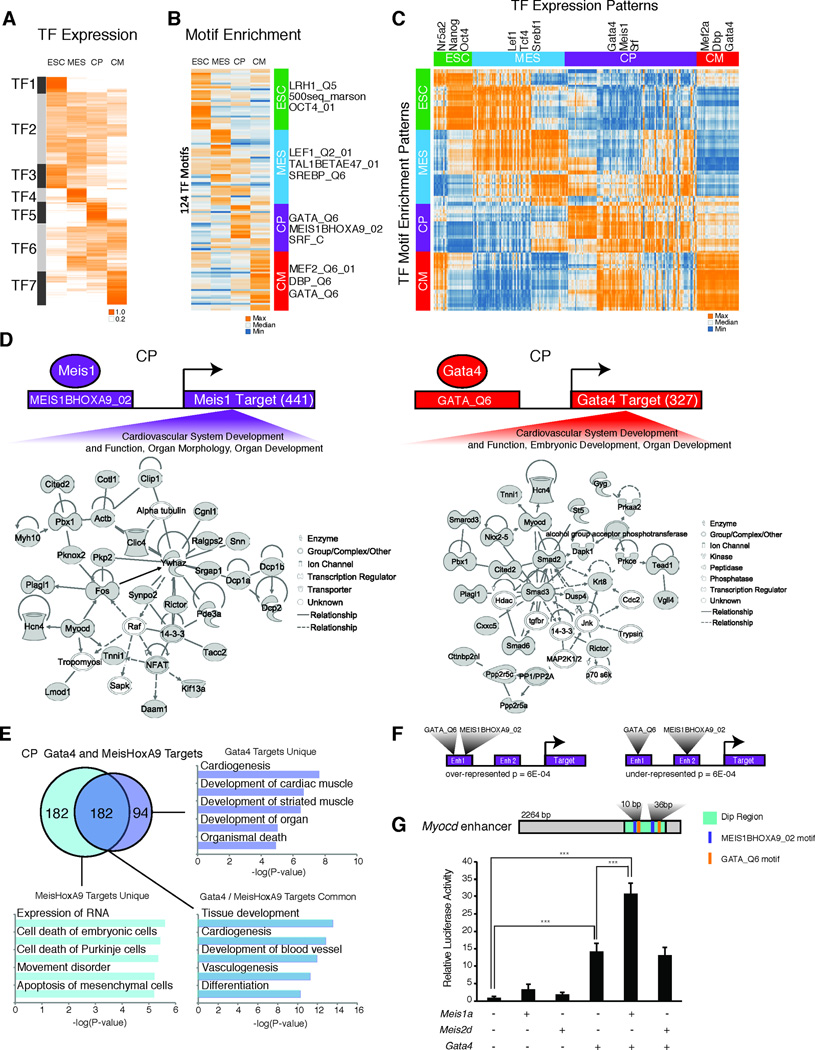
Heart development is exquisitely sensitive to the precise temporal regulation of thousands of genes that govern developmental decisions during differentiation. However, we currently lack a detailed understanding of how chromatin and gene expression patterns are coordinated during developmental transitions in the cardiac lineage. Here, we interrogated the transcriptome and several histone modifications across the genome during defined stages of cardiac differentiation. We find distinct chromatin patterns that are coordinated with stage-specific expression of functionally related genes, including many human disease-associated genes. Moreover, we discover a novel preactivation chromatin pattern at the promoters of genes associated with heart development and cardiac function. We further identify stage-specific distal enhancer elements and find enriched DNA binding motifs within these regions that predict sets of transcription factors that orchestrate cardiac differentiation. Together, these findings form a basis for understanding developmentally regulated chromatin transitions during lineage commitment and the molecular etiology of congenital heart disease.


Figures

Figure 1
Figure 1. Transcriptional analysis of cardiac differentiation
A. The four stages of differentiation analyzed in this study. B. Hierarchical clustering of coding and non-coding polyA+ gene expression, across the four cell types. Enriched GO terms and example genes are shown to the right. C. Hierarchical clustering of miRNA expression (565 miRNAs included in NanoString probe set). D. Hierarchical clustering of lncRNA expression including 196 lncRNAs expressed at >1 RPKM in at least one time point. E. Enriched GO terms for the two nearest genes adjacent to the lncRNA genes expressed in the time course. F. Expression correlation between lncRNAs and-adjacent gene minus correlation of adjacent gene with the other neighbour in a three gene set in a 100 kb window, as compared to background model generated by randomly sampling similar sets of three genes. Distribution of the correlation differences in the background is plotted as the black curve. Difference in expression correlation for lncRNAs is significant (P= 0.0275, red line) relative to our background model. G. Example lncRNAs and highly correlated adjacent genes identified in expression clusters N, Q and S. Graphs display examples of genes with known roles in heart development (Gata6, Hand2 and Myocd) and expression pattern during the time course. See also Tables S1 and S2, Figures S1 and S2, and Movie S1.
Figure 2
Figure 2. Chromatin state transitions during cardiac differentiation
A. Hierarchal clustering of genes based on enrichment of histone modifications and RNA Polymerase (serine 5 phosphorylated) within 2 kb of the TSS. Color represents median enrichment for each cluster of genes. Number of genes within each cluster is shown on the right. B. The overlap of genes between chromatin clusters (vertical axis) and expression clusters (horizontal axis). Color represents the Pearson residuals. Yellow represents significant overlap between the genes within chromatin cluster and expression cluster.. See also Table S3.
Figure 3
Figure 3. Dynamic and highly correlated chromatin and gene expression patterns during cardiomyocyte differentiation
A. Heat maps (top) of magnitude transformed, chromatin fold enrichment values and gene expression values, for co-cluster A11. Co-cluster A11 correlation network (bottom), where nodes represent genes in each module and edges (red lines) represent Pearson correlations of chromatin marks, calculated with the magnitude transformed values with a threshold of 0.9. Node color corresponds to gene expression state; yellow and black indicates up- and down-regulated expression, respectively. B. Co-cluster L9, analysed in the same manner as co-cluster A11. C. Sub-groups of expression cluster S based on chromatin pattern segregate genes with distinct gene ontology. Chromatin and gene expression values are represented as median +/− interquartile range among all genes graphed. Expression values were normalized by interquartile range within each gene.
Figure 4
Figure 4. H3K4me1 marks cardiac contractile genes prior to gene activation
A. Fraction of H3K4me1-marked genes that overlap with H3K4me3. An enrichment value at the TSS of 3 was used as the threshold to distinguish marked from unmarked genes. B. Average expression (RPKM) of genes marked with H3K4me1, H3K4me3, both H3K4me1 and H3K4me3, or neither modification for each stage of differentiation. C. Example of a pre-activated gene, Actc1. ChIP-Seq (H3K4me1, H3K27ac, H3K4me3, y-axis reads/million unique mapped reads) and RNA-Seq (FPKM) genome tracks (mm9) are shown. Scale for each modification is constant throughout the time course. D. Classification of genes based on gain of H3K4me1 and H3K4me3 enrichment at the TSS. Enrichment for genes with MGI cardiovascular expression was calculated using a Pearson residual. E. Example genes for each group. Left axis represents mean normalized chromatin enrichment values at the TSS. Right axis represents RPKM expression value.
Figure 5
Figure 5. Identification of enhancer elements during cardiac differentiation
A. Total distal enhancers identified in ESC, MES, CP, and CM categorized by H3K27ac and H3K4me1 status at each stage. B. Distribution of enhancers across the genome. C. Density of ChIP-Seq reads +/− 4kb relative to the midpoint of enriched regions for H3K4me1, H3K27ac and RNA Polymerase (serine 5 phosphorylated form). D. Boxplots of log2 transformed (FPKM) gene expression values for single nearest gene associated with unmarked (U), poised (P), and active (A) enhancer groups. p-values determined by Wilcoxon rank sum test with continuity correction. Boxplots show interquartile ranges (IQR) with whiskers extending to the furthest data point that was no further than 1.5 times the IQR from the interquartile boundaries. E. −Log(Binomial FDR Q-value) scores for GO Biological Process enriched in single nearest gene associated with active enhancers.
Figure 6
Figure 6. Transitioning enhancer states during cardiac differentiation
A. Union set of enhancers combined from all 4 time points during cardiomyocyte differentiation clustered based on Unmarked, Poised (H3K4me1+) or Active (H3K27ac+;H3K4me1+/−) enhancers. B. Example ChIP-Seq (H3K4me1, H3K27ac, H3K4me3, y-axis reads/million unique mapped reads) and RNA-Seq (RPKM) genome tracks (mm9). Scale for each modification is constant throughout the time course. C. Enhancer state transitions in similar cell types relative to distant cell types.
Figure 7
Figure 7. Enhancer gene networks critical for heart development
A. Hierarchical clustering of magnitude normalized FPKM values for transcription factors expressed during cardiac differentiation, subdivided into 7 groups (TF1–TF7). B. Clustering of magnitude normalized density based motif enrichment scores (−log(p-value)) shows stage specific enrichment of highly conserved TF motifs. C. Pearson correlation matrix between enriched TF motifs and the expression pattern of TFs known to bind the list of highly conserved motifs. D. Examples of predicted target gene networks. Grey nodes represent genes identified via motif enrichment analysis. E. Venn diagram shows overlap between MEISHOXA9 and GATA6_Q6 motif containing target genes, with associated GO terms for unique and common targets. F. Graphical representation of the preference for MEISHOXA9 and GATA6_Q6 motifs to occupy the same enhancer versus separate enhancers at common gene targets. G. Meis1a and Gata4 synergistically activate the Myocd enhancer. A graphical representation of the candidate MEIS and GATA sites within the enhancer dip are shown. The graph shows relative luciferase reporter activity normalized to reporter construct alone. Data are represented as mean + SEM. N=4; ***P<0.001 by ANOVA.

Comment in

References

    1. Anders S, Huber W. Differential expression analysis for sequence count data. Genome Biol. 2010;11:R106. - PMC - PubMed
    1. Barski A, Cuddapah S, Cui K, Roh TY, Schones DE, Wang Z, Wei G, Chepelev I, Zhao K. High-resolution profiling of histone methylations in the human genome. Cell. 2007;129:823–837. - PubMed
    1. Blow MJ, McCulley DJ, Li Z, Zhang T, Akiyama JA, Holt A, Plajzer-Frick I, Shoukry M, Wright C, Chen F, et al. ChIP-Seq identification of weakly conserved heart enhancers. Nature genetics. 2010;42:806–810. - PMC - PubMed
    1. Bruneau BG. The developmental genetics of congenital heart disease. Nature. 2008;451:943–948. - PubMed
    1. Cabili MN, Trapnell C, Goff L, Koziol M, Tazon-Vega B, Regev A, Rinn JL. Integrative annotation of human large intergenic noncoding RNAs reveals global properties and specific subclasses. Genes & development. 2011;25:1915–1927. - PMC - PubMed

Publication types