. 2012 Nov 2;11(5):633-48.
doi: 10.1016/j.stem.2012.07.006. Epub 2012 Sep 13.

Epigenomic annotation of enhancers predicts transcriptional regulators of human neural crest

Affiliations

Epigenomic annotation of enhancers predicts transcriptional regulators of human neural crest

Alvaro Rada-Iglesias et al. Cell Stem Cell. .

Abstract

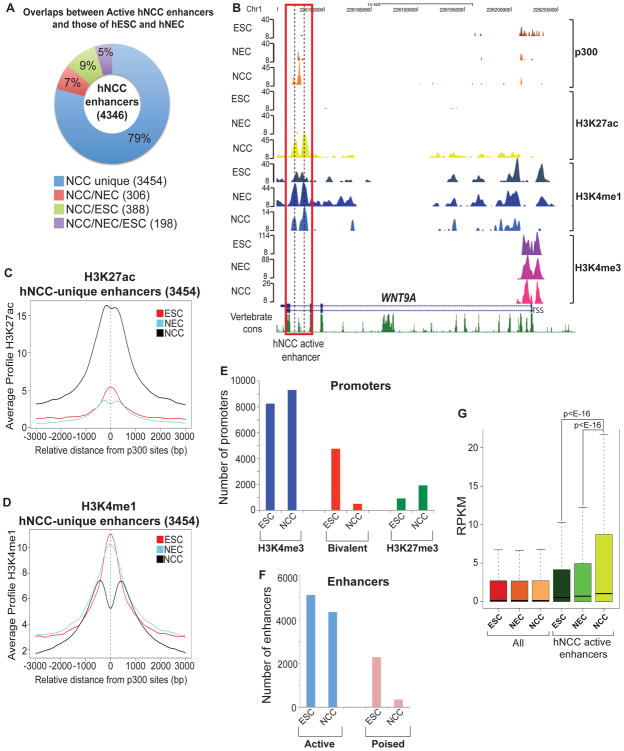
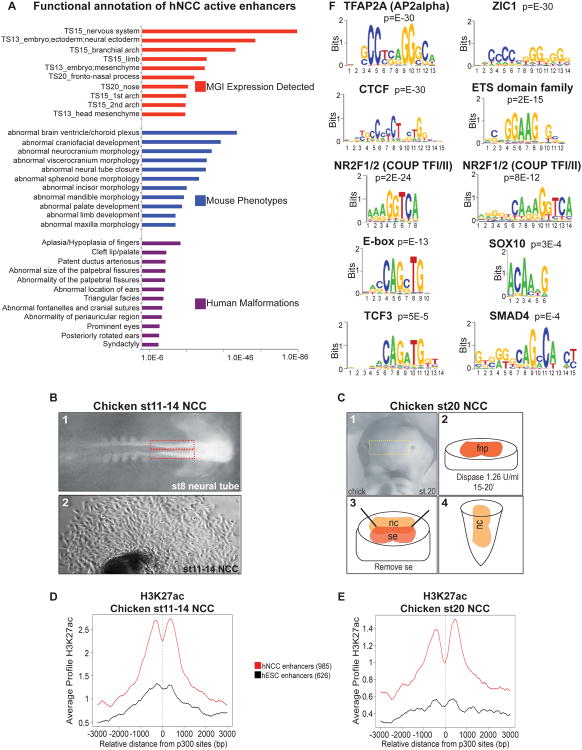
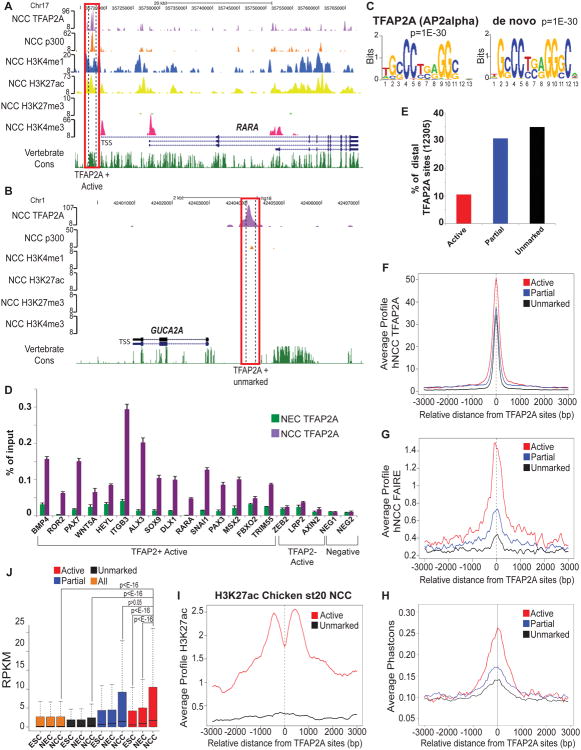
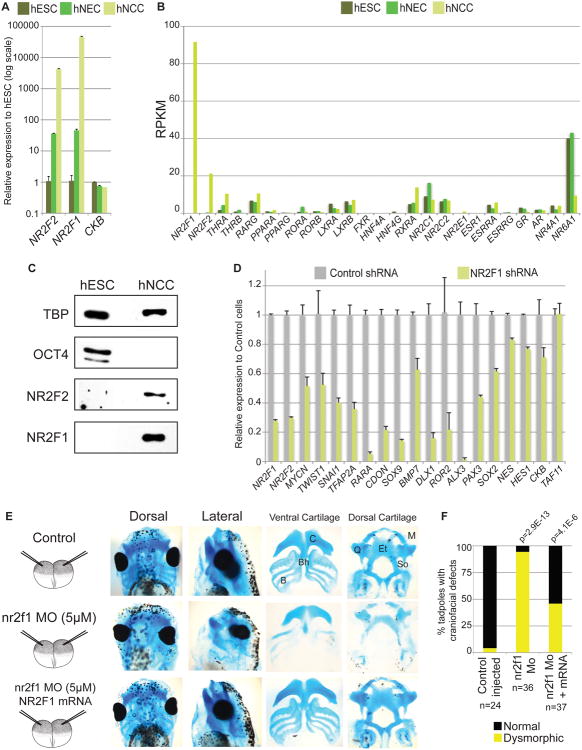
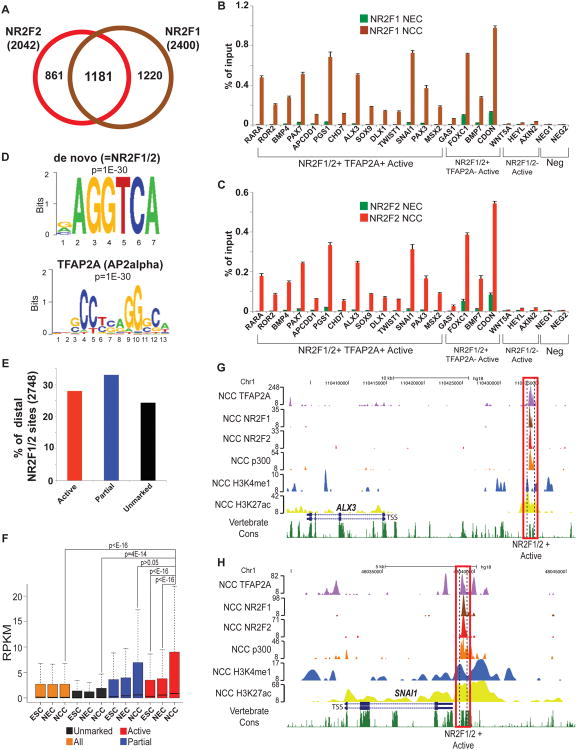
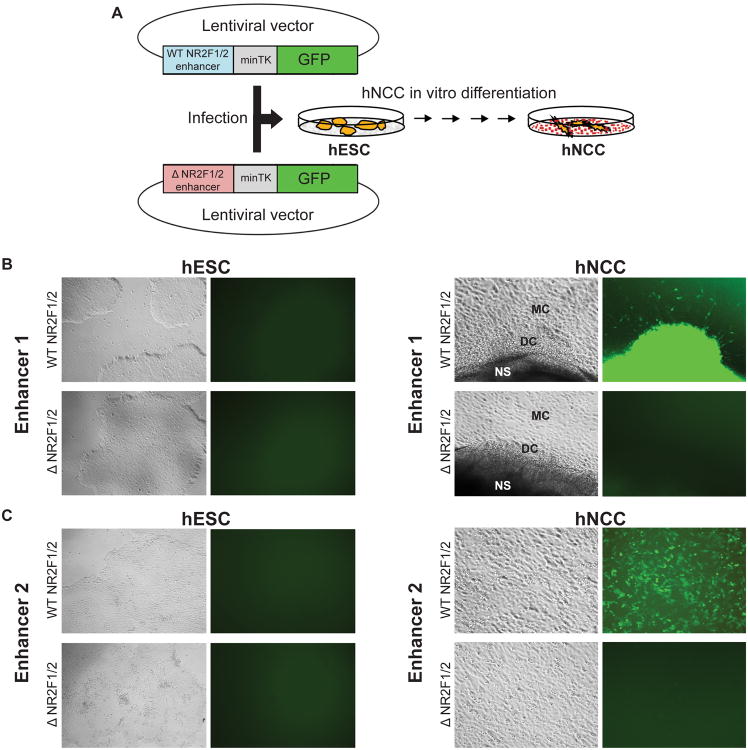
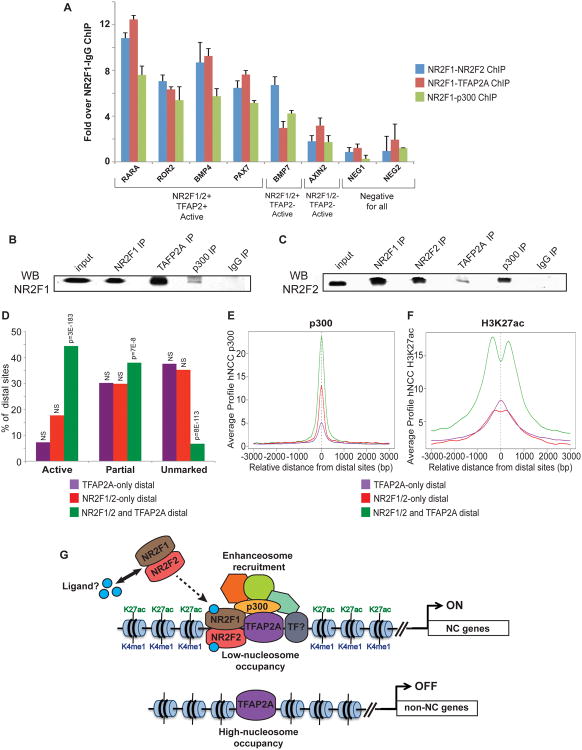
Neural crest cells (NCC) are a transient, embryonic cell population characterized by unusual migratory ability and developmental plasticity. To annotate and characterize cis-regulatory elements utilized by the human NCC, we coupled a hESC differentiation model with genome-wide profiling of histone modifications and of coactivator and transcription factor (TF) occupancy. Sequence analysis predicted major TFs binding at epigenomically annotated hNCC enhancers, including a master NC regulator, TFAP2A, and nuclear receptors NR2F1 and NR2F2. Although many TF binding events occur outside enhancers, sites coinciding with enhancer chromatin signatures show significantly higher sequence constraint, nucleosomal depletion, correlation with gene expression, and functional conservation in NCC isolated from chicken embryos. Simultaneous co-occupancy by TFAP2A and NR2F1/F2 is associated with permissive enhancer chromatin states, characterized by high levels of p300 and H3K27ac. Our results provide global insights into human NC chromatin landscapes and a rich resource for studies of craniofacial development and disease.


Conflict of interest statement

The authors declare no conflict of interest.

Figures

Figure 1
Figure 1. Epigenomic mapping uncovers hNCC enhancer elements (see also Figure S1)
(A) Cell type-specificity of hNCC active enhancer regions. (B) p300, H3K27ac, H3K4me1 and H3K4me3 enrichment profiles in hESC, hNEC and hNCC at a representative hNCC enhancer (e.g. WNT9A). The peak height corresponds to normalized fold-enrichments calculated by QuEST. (C) Average hNCC H3K27ac and (D) H3K4me1 ChIP-seq signal profiles around the central position of p300 peaks at unique hNCC active enhancers. (E) Number of H3K4me3-only, bivalent (i.e. enriched in both H3K4me3 and H3K27me3) and H3K27me3-only promoters in hESC and hNCC. (F) Number of active and poised enhancers in hESC and hNCC. (G) Gene expression, measured as RPKMs, calculated for all human ENSEMBL genes and for those closest (within 100 Kb) to hNCC active enhancers. Expression levels presented as boxplots. P-values calculated using paired Wilcoxon tests.
Figure 2
Figure 2. Functional annotation and sequence analysis of active hNCC enhancers (see also Figure S2)
(A) Annotation of hNCC active enhancers. Mouse Genome Informatics (MGI) Expression Detected (red) contains information on tissue and developmental stage– specific expression in mouse; Mouse Phenotypes (blue) ontology contains data on mouse genotype-phenotype associations; Human Malformations (purple) ontology contains data on human genotype - phenotype associations. The x-axis values correspond to Binomial raw (uncorrected) p-values. (B) Dorsal anterior neural folds from st8 chicken embryos were excised (red line) and cultured ex vivo for 72 hours, resulting in emigration of NCC estimated to correspond to chicken st11-14 cranial NCC. (C) Chicken st20 NCC were isolated in vivo from frontonasal prominences (FNP). FNPs were incubated with dispase in order to remove the surface ectoderm and forebrain neuroectoderm, which resulted in FNPs solely comprised of NCC. (D-E) Average ChIP-seq H3K27ac profiles from chicken NCC at st11-14 (D) or st20 (E) generated around central positions of hNCC enhancers conserved in the chicken genome. (F) Select overrepresented DNA sequence motifs enriched at hNCC active enhancers. Statistical significance (p-value) of the motifs over-representation is shown.
Figure 3
Figure 3. Occupancy of TFAP2A at active hNCC enhancers (see also Figures S3 and S9)
(A-B) ChIP-seq enrichment profiles in hNCC for two representative TFAP2A bound loci, either (A) overlapping an active hNCC enhancer or (B) occurring within unmarked chromatin. The peak height corresponds to normalized fold-enrichments calculated by QuEST. (C) Top overrepresented motifs enriched at distal TFAP2A-bound regions based on matches to known transcription factors (left) or through de novo motif analysis (right). (D) TFAP2A ChIP-qPCR analyses of select distal TFAP2A sites identified by ChIP-seq performed from chromatin isolated from hNCC or neurectodermal spheres (hNEC), just prior to attachment and emigration of hNCC. Error bars represent standard deviation from three technical replicates. (E) Percentage of distal TFAP2A sites that overlapped active hNCC enhancers (red), regions with a partial active enhancer signature (blue) or unmarked chromatin (black). (F-H) Average TFAP2A ChIP-seq (F), FAIRE-seq (G) and vertebrate Phastcons (H) signal profiles around the central position of distal TFAP2A regions overlapping active hNCC enhancers (red), or displaying a partial active enhancer signature (blue) or occurring within unmarked chromatin (black). (I) Average chicken st20 NCC H3K27ac ChIP-seq signal profiles around the central position of TFAP2A bound regions conserved in the chicken genome and overlapping active hNCC enhancers (red) or occurring within unmarked chromatin (black). (J) Gene expression, measured as RPKMs, was calculated for all human ENSEMBL genes and for those closest (within 100Kb) to distal TFAP2A bound regions overlapping active hNCC enhancers (red), displaying a partial active enhancer signature (blue) or occurring within unmarked chromatin (black). Expression levels presented as boxplots. P-values calculated using Wilcoxon tests.
Figure 4
Figure 4. NR2F1/2 are induced in hNCC, regulate expression of NC genes in vitro and craniofacial development in vivo (see also Figures S4 and S5)
(A) Expression of NR2F1 and NR2F2 was measured in hESC, hNEC and hNCC using RT-qPCR. Expression normalized to that of the housekeeping gene EEF2 and presented relative to hESC in a logarithmic scale is shown. Error bars represent standard deviation from three technical replicates. (B) Expression of select nuclear receptors, including NR2F1 and NR2F2 as measured by RNA-seq (RPKMs). (C) Immunoblot analyses of TBP, OCT4, NR2F2 and NR2F1 in hESC and hNCC. (D) Expression of indicated genes was measured by RT-qPCR in hNCC expressing shRNA against NR2F1 (green). For all genes, expression is normalized to that of the housekeeping gene EEF2 and presented relative to hNCC expressing control-scrambled shRNA (gray). Error bars represent standard deviation from three technical replicates. (E) Craniofacial defects in tadpoles raised from 2-cell stage embryos injected into both blastomeres with nr2f1 MO, control-injected or co-injected with nr2f1 MO and human NR2F1 mRNA. Embryos were stained with alcian blue beyond stage 40-45 to visualize craniofacial cartilages. For each set of injected embryos, dorsal and lateral views of the head are shown, as well as dissected ventral (i.e. C: ceratohyal, Bh: basihyal, B: branchial) and dorsal cartilages (M: Meckel, Q: quadrate, Et: ethmoid, So: subocular). (F) Penetrance of craniofacial dysmorphisms in analyzed tadpoles. P-values were calculated using hypergeometric tests and represent the statistical significance of the nr2f1 MO induced defects (vs control) and of the NR2F1 mRNA rescues (vs nr2f1 MO), respectively.
Figure 5
Figure 5. Genome-wide analysis of NR2F1/2 occupancy in hNCC (see also Figure S6)
(A) Overlap between NR2F1 (brown) and NR2F2 (red) binding sites in hNCC. (B-C) Chromatin isolated from hNCC and neurectodermal spheres (hNEC), just prior to attachment and emigration of hNCC was used for NR2F1 (B) and NR2F2 (C) ChIP-qPCRs. Error bars represent standard deviation from three technical replicates. (D) Top overrepresented motifs enriched at distal NR2F1/2-bound regions based on either de novo motif analysis (top, which matches NR2F1/2 motif) or matches to known transcription factors (bottom). (E) Percentage of distal NR2F1/2 sites that overlapped active hNCC enhancers (red), regions with a partial active enhancer signature (blue) or that occurred within unmarked chromatin (black). (F) Expression levels, measured as RPKMs, were calculated for all human ENSEMBL genes and for those closest (within 100 Kb) to distal NR2F1/2 bound regions overlapping active hNCC enhancers (red), or displaying a partial active enhancer signature (blue) or occurring within unmarked chromatin (black). Expression levels presented as boxplots. P-values calculated using Wilcoxon tests. (G-H) ChIP-seq enrichment profiles in hNCC for two representative NR2F1/2-bound loci (proximal to ALX3 (G) and SNAI1 (H)) overlapping active hNCC enhancers.
Figure 6
Figure 6. In vitro reporter assays demonstrate the importance of NR2F1/2 sites for hNCC enhancer activity (see also Figure S7)
(A) Schematic representation of in vitro reporter assays. Select enhancers with intact (WT) or deleted (Δ) NR2F1/2 sites were cloned in front of a minimal promoter driving GFP expression. The resulting lentiviral vectors were used to infect hESC and GFP expression was subsequently followed during hNCC differentiation. (B-C) Bright field and GFP images for two select enhancers in either hESC (left panels) or hNCC (right panels). In both cases, representative images obtained with intact (WT) enhancers or enhancers with deleted (Δ) NR2F1/2 sites are shown. NS: neurosphere, DC: delaminating neural crest cells, MC: migratory NCC.
Figure 7
Figure 7. TFAP2A, NR2F1/2 simultaneously bind and cooperate at hNCC enhancers (see also Figure S8)
(A) Sequential ChIPs were performed using NR2F1 as the first antibody, followed by NR2F2 (blue), TFAP2A (red) or p300 (green) antibodies. Resulting material was analyzed by qPCR analyses of select hNCC enhancers. Y-axis shows fold enrichment over a NR2F1-IgG sequential ChIP. Error bars represent standard deviation from three technical replicates. (B-C) NR2F1 (B) and NR2F2 (C) immunoblot analyses of NR2F1, NR2F2, TFAP2A, p300 or IgG immunoprecipitates from hNCC nuclear extracts. (D) Percentage of distal sites bound only by TFAP2A (purple), bound only by NR2F1/2 (red) or co-bound by both TFAP2A and NR2F1/2 (green) and overlapping active hNCC enhancers, or regions with a partial active enhancer signature or occurring within unmarked chromatin. P-values were calculated using hypergeometric tests, based on comparisons with all TFAP2A and NR2F1/2 combined bound regions (n=13990). NS=non-significant (p>0.05). (E-F) Average p300 (E) and H3K27ac (F) ChIP-seq signal profiles generated around the central position of distal regions bound only by TFAP2A (purple), bound only by NR2F1/2 (red) or co-bound by both TFAP2A and NR2F1/2 (green). (G) Proposed model of hNCC enhancer activation, whereby a master lineage specifier, TFAP2A, and effectors of ligand-dependent signaling, NR2F1/2, simultaneously bind enhancer sequences and synergistically lead to the establishment of transcriptionally permissive enhancer chromatin states and gene activation. Additional TFs (depicted as ‘TFs?’), including NC specifiers and effectors of major signaling pathways (e.g. BMP, WNT) are also likely involved in the combinatorial recruitment of productive enhanceosomes

References

    1. Amiel J, Benko S, Gordon CT, Lyonnet S. Disruption of long-distance highly conserved noncoding elements in neurocristopathies. Ann N Y Acad Sci. 2010;1214:34–46. - PubMed
    1. Aybar MJ, Nieto MA, Mayor R. Snail precedes slug in the genetic cascade required for the specification and migration of the Xenopus neural crest. Development. 2003;130:483–494. - PubMed
    1. Bajpai R, Chen DA, Rada-Iglesias A, Zhang J, Xiong Y, Helms J, Chang CP, Zhao Y, Swigut T, Wysocka J. CHD7 cooperates with PBAF to control multipotent neural crest formation. Nature. 2010;463:958–962. - PMC - PubMed
    1. Bellmeyer A, Krase J, Lindgren J, LaBonne C. The protooncogene c-myc is an essential regulator of neural crest formation in xenopus. Dev Cell. 2003;4:827–839. - PubMed
    1. Betancur P, Bronner-Fraser M, Sauka-Spengler T. Assembling neural crest regulatory circuits into a gene regulatory network. Annu Rev Cell Dev Biol. 2010;26:581–603. - PMC - PubMed

Publication types

MeSH terms