. 2012 Oct 26;48(2):231-41.
doi: 10.1016/j.molcel.2012.08.009. Epub 2012 Sep 13.

Direct regulation of GTP homeostasis by (p)ppGpp: a critical component of viability and stress resistance

Affiliations

Direct regulation of GTP homeostasis by (p)ppGpp: a critical component of viability and stress resistance

Allison Kriel et al. Mol Cell. .

Abstract

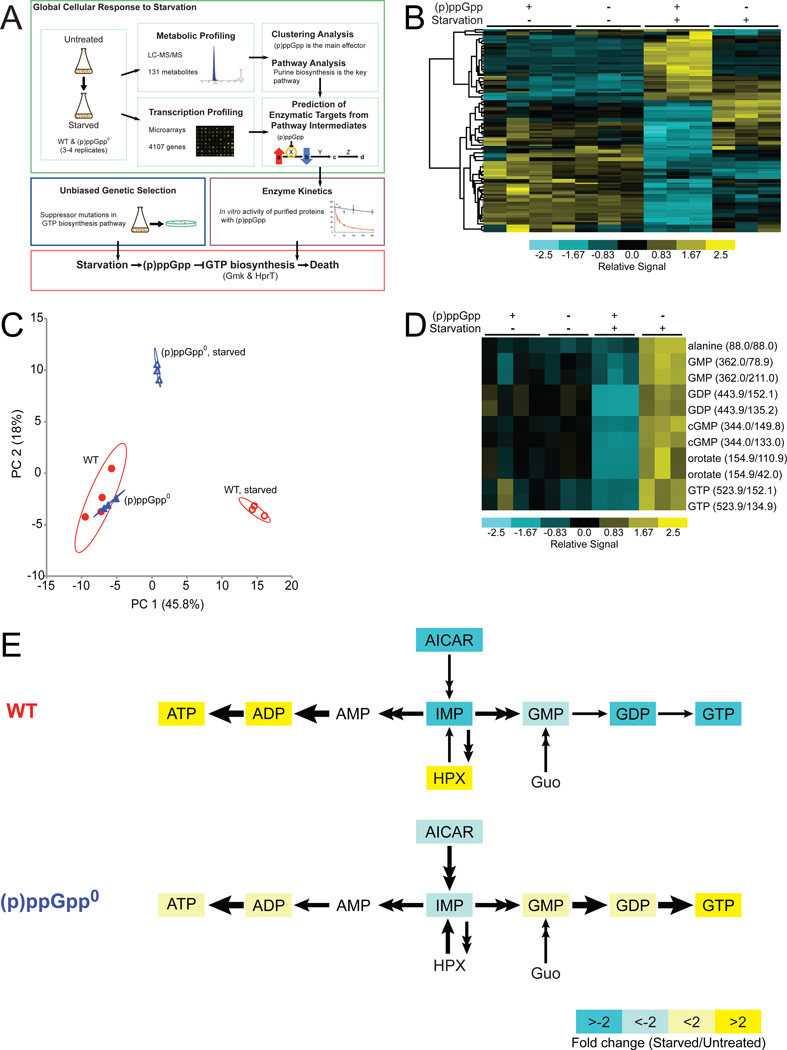
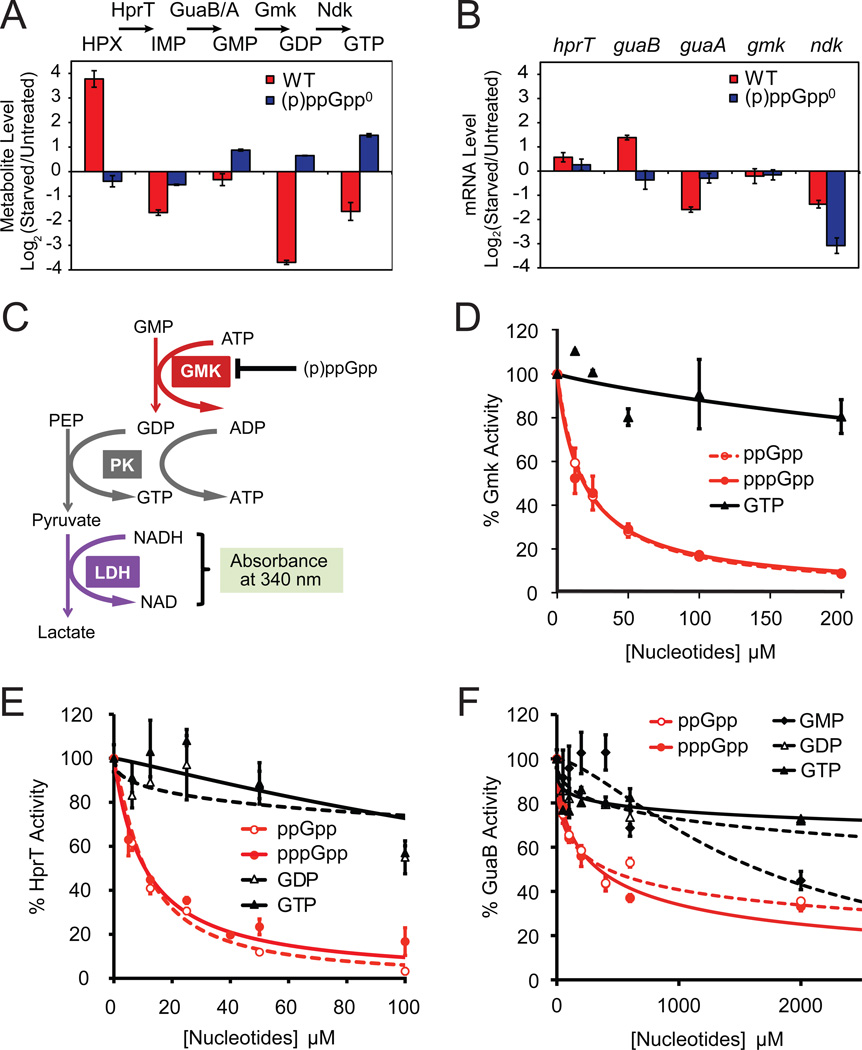
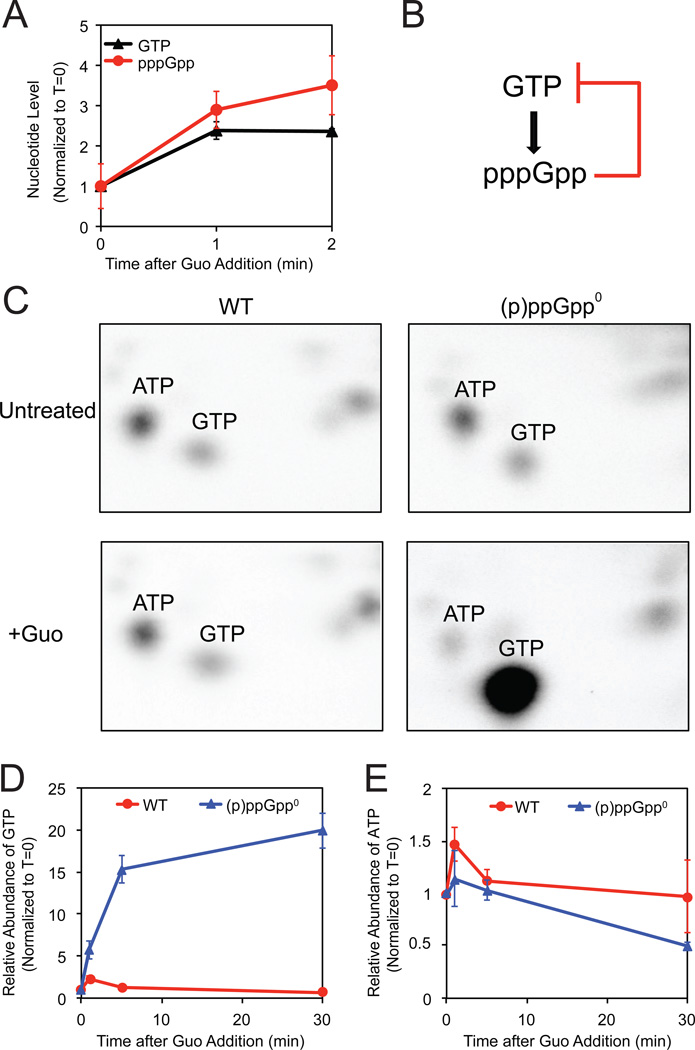
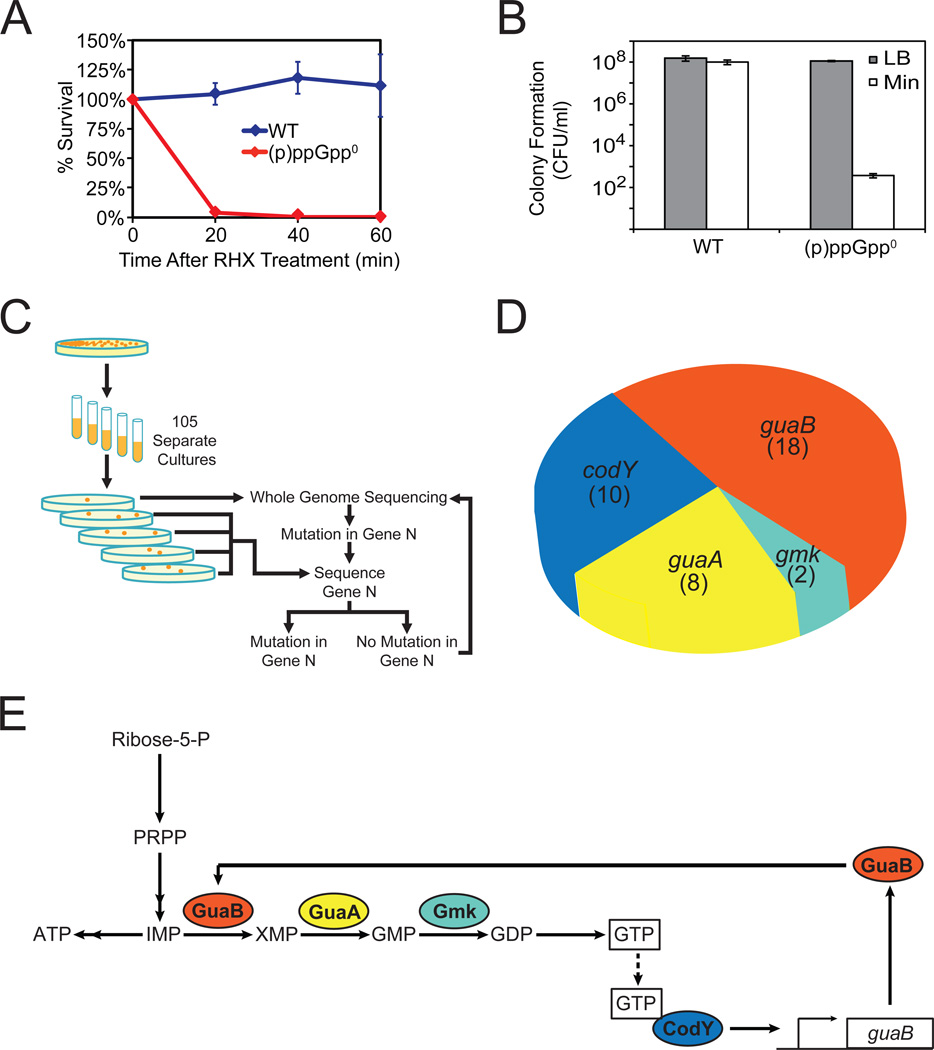
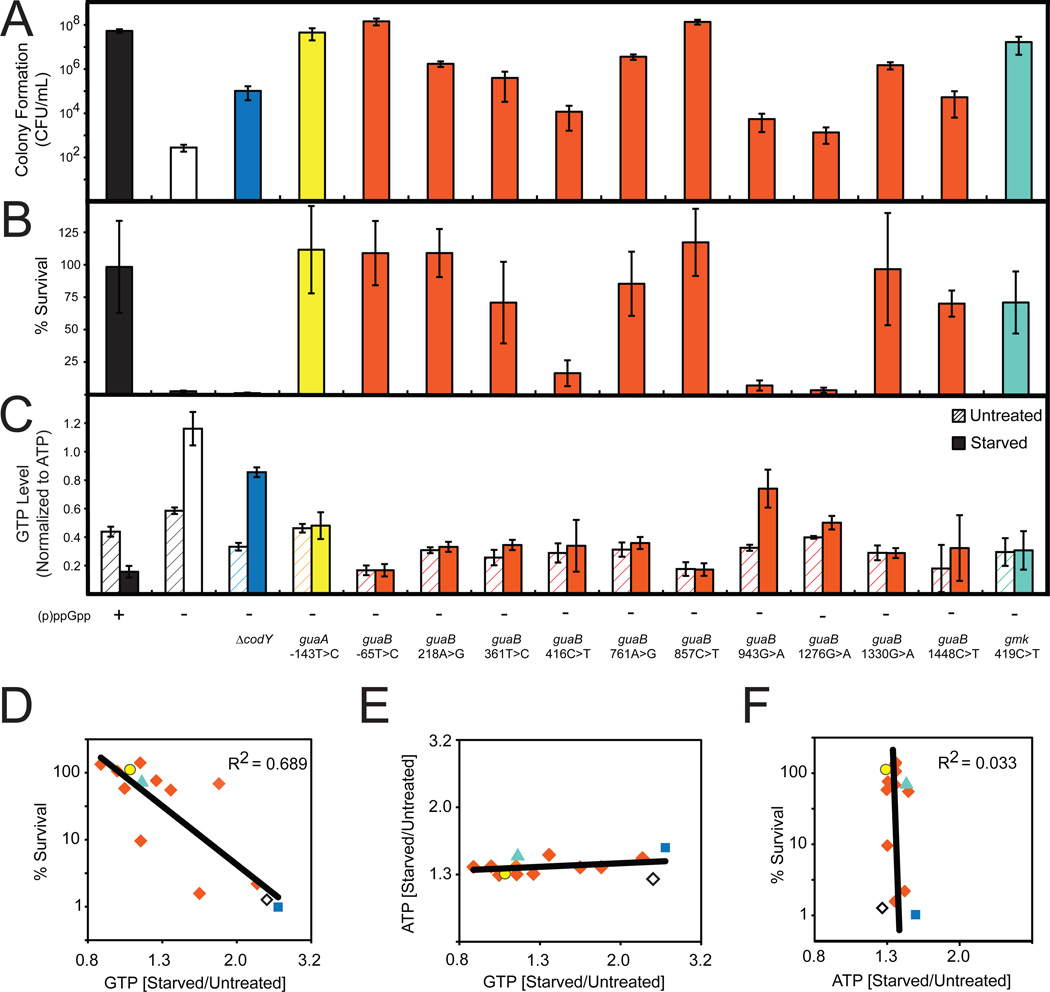
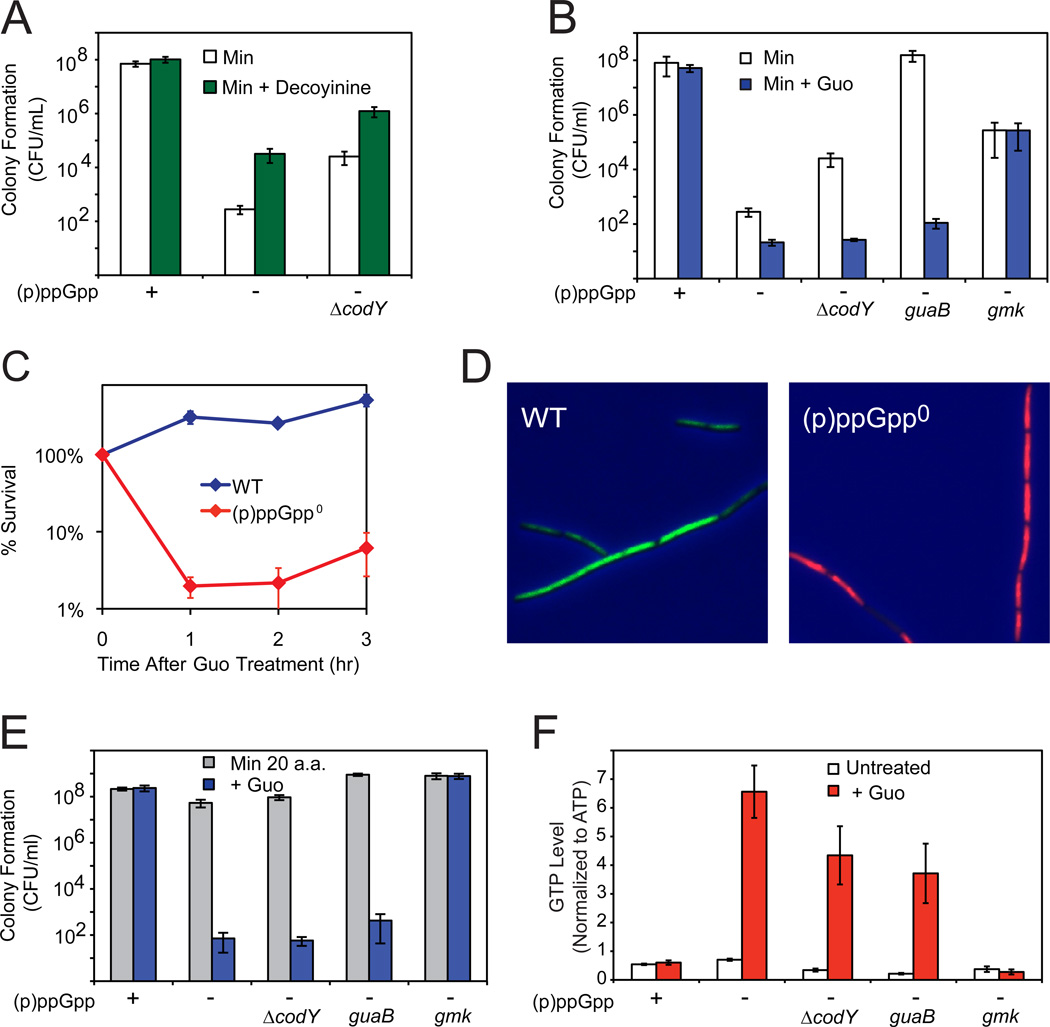
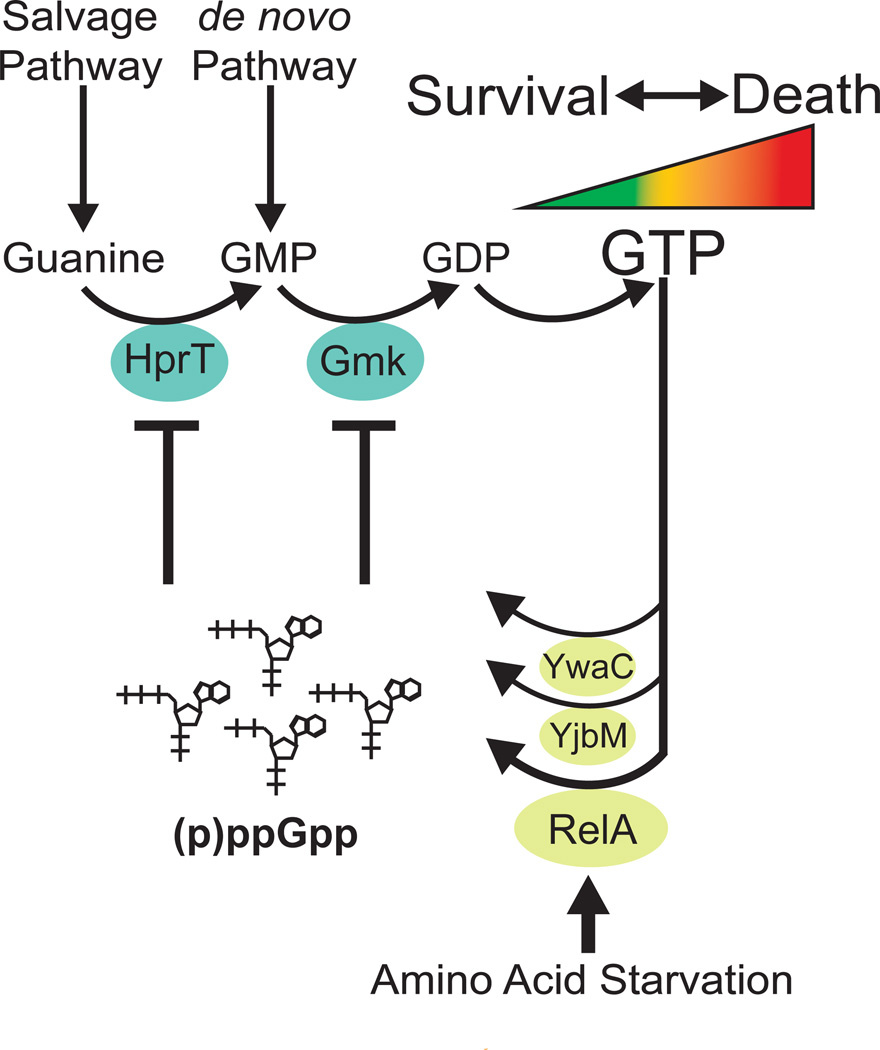
Cells constantly adjust their metabolism in response to environmental conditions, yet major mechanisms underlying survival remain poorly understood. We discover a posttranscriptional mechanism that integrates starvation response with GTP homeostasis to allow survival, enacted by the nucleotide (p)ppGpp, a key player in bacterial stress response and persistence. We reveal that (p)ppGpp activates global metabolic changes upon starvation, allowing survival by regulating GTP. Combining metabolomics with biochemical demonstrations, we find that (p)ppGpp directly inhibits the activities of multiple GTP biosynthesis enzymes. This inhibition results in robust and rapid GTP regulation in Bacillus subtilis, which we demonstrate is essential to maintaining GTP levels within a range that supports viability even in the absence of starvation. Correspondingly, without (p)ppGpp, gross GTP dysregulation occurs, revealing a vital housekeeping function of (p)ppGpp; in fact, loss of (p)ppGpp results in death from rising GTP, a severe and previously unknown consequence of GTP dysfunction.


Figures

Figure 1
Figure 1. Metabolic Profiling of Wild-type and (p)ppGpp0 Cells upon Amino Acid Starvation
(A) Discovery of critical direct targets of (p)ppGpp during starvation in B. subtilis. For metabolic profiling, wild-type (WT) and (p)ppGpp0 cells were starved and metabolites were quantified by LC-MS/MS. Changes in metabolite signatures were analyzed to reveal (p)ppGpp as the major effector of the starvation response and to identify purine biosynthesis as significantly altered. To identify targets of (p)ppGpp, the pathway was examined for steps in which levels of a substrate increased while levels of the product decreased. Transcriptional profiling indicated that the identified targets were regulated post-transcriptionally. Predicted targets were assayed for enzymatic inhibition by (p)ppGpp in vitro. In parallel, a genetic screen was performed in (p)ppGpp0 cells, which identified mutations that lower GTP biosynthesis. These results revealed that the crucial function of (p)ppGpp during starvation is to directly inhibit the activities of GTP biosynthesis enzymes. (B) Clustering analysis of metabolite profiles obtained by LC-MS/MS. Rows correspond to 55 metabolites that display significant changes in WT ((p)ppGpp +) or (p)ppGpp0 ((p)ppGpp −) cells in the presence (+) or absence (−) of starvation. Columns correspond to samples labeled above the heat map; ≥ 3 experimental replicates are shown. Samples and metabolites were hierarchically clustered using Cluster and plotted with TreeView. Metabolite levels are normalized to total ion current (TIC) and are indicated by color: high levels are yellow and low levels are blue. An expanded, annotated view is presented in Figure S1. (C) PCA analyzes correlations among the metabolite profiles in WT and (p)ppGpp0 samples and identifies independent factors (principal components) that explain the variation between samples. Principal components 1 (PC1) and 2 (PC2) comprise nearly 64% of the total variation. The 95% confidence interval is circled around each sample set. (D) A cluster is magnified from a complete sub-branch of 1B. Metabolites were quantified by the levels of their daughter ions (1–2 daughter ions), with parent/daughter ion masses indicated. (E) Starvation-induced changes in the purine biosynthesis pathway. Metabolites with significant changes (q-value < 1% for both daughter ions) in WT and (p)ppGpp0 cells are colored: yellow and blue indicate increased and decreased levels, respectively; white indicates no significant change. HPX: hypoxanthine, Guo: guanosine.
Figure 2
Figure 2. (p)ppGpp Directly Inhibits Multiple GTP Biosynthesis Enzymes
(A) Quantification of LC-MS/MS data suggests that upon starvation, conversions from hypoxanthine (HPX) to IMP (by HprT) and from GMP to GDP (by Gmk) are blocked in WT but not (p)ppGpp0 cells. Log2 ratios of metabolite levels between starved and untreated samples are plotted. Red: WT; blue: (p)ppGpp0 cells. One daughter ion is used for calculation; nearly identical results were obtained from the second daughter ion (not shown). Error bars = standard error (n ≥ 3) for this and all subsequent figures. (B) Microarray-based profiling shows that mRNA levels of hprT and gmk are not down-regulated by starvation. Log2 ratios of mRNA levels between starved and untreated samples are plotted. Red: WT; blue: (p)ppGpp0 cells. (C) Schematic of the in vitro three-step coupled assay for Gmk enzymatic activity. PK: pyruvate kinase, LDH: lactate dehydrogenase, PEP: Phospho(enol)pyruvate. (D) (p)ppGpp potently inhibits the enzymatic activity of Gmk in vitro. Gmk activity was measured with 10 nM Gmk, 4 mM ATP, 1.5 mM PEP, 150 µM NADH, 2U PK, 2.64U LDH, 50 µM GMP. The relative activity (V0 with inhibitors / without inhibitors) is plotted as a function of concentration of the indicated nucleotide inhibitors. V0 is obtained as in Figure S2C. (E) (p)ppGpp potently inhibits B. subtilis HprT activity in vitro. HprT activity was measured with 20 nM HprT, 50 µM guanine and 1 mM PRPP, and plotted as a function of concentration of the indicated inhibitors. V0 is obtained as in Figure S2D. (F) (p)ppGpp and GMP modestly inhibit GuaB activity in vitro. GuaB activity was measured with 50 nM GuaB, 400 µM IMP, and 2.5 mM NAD, and plotted as a function of concentration of the indicated inhibitors. V0 is obtained as in Figure S2E.
Figure 3
Figure 3. pppGpp Mediates Feedback Control of GTP Levels
(A) pppGpp levels increase concomitantly with increased GTP levels in WT cells following guanosine treatment (Guo). 32P-labeled WT cells were treated with 1 mM Guo. At the indicated times after treatment, nucleotides were extracted, measured by TLC, and normalized to T=0. (B) Schematic of a negative feedback loop of GTP synthesis with pppGpp. (C) Two-dimensional TLC of 32P-labeled nucleotides with ATP and GTP indicated. WT (left panels) and (p)ppGpp0 (right panels) cells before (upper panels) and 20 minutes after addition of 1 mM Guo (lower panels) are shown. (D–E) Quantification of GTP (D) and ATP (E) levels by LC-MS/MS of WT (red) and (p)ppGpp0 (blue) cells in a time course after treatment with 1 mM Guo, normalized to T=0.
Figure 4
Figure 4. (p)ppGpp0 Phenotype and a Genetic Selection for Suppressor Mutations
(A) (p)ppGpp0 cells do not survive sudden starvation. WT and (p)ppGpp0 cells were treated with 0.5 mg/ml RHX for the indicated time and plated on LB. Percent survival was calculated by counting the number of cells able to form colonies the next day, normalized to T=0. (B) (p)ppGpp0 cells fail to form colonies on minimal medium plates. WT and (p)ppGpp0 cells were plated on LB and minimal medium plates, and colonies were counted the next day. CFU/ml: colony forming unit (CFU) per ml of culture, normalized by OD600. (C) Schematic of genetic selection for (p)ppGpp0 suppressor mutants that can form colonies on minimal medium. Suppressors were selected on minimal medium plates. Whole genome sequencing was conducted on one suppressor to identify a mutation in one gene, followed by targeted sequencing of this gene in all other suppressors. An additional suppressor was subsequently identified by whole-genome sequencing. This process was repeated iteratively. (D) Distributions of (p)ppGpp0 suppressor mutations in the indicated genes. The numbers indicate independently isolated suppressors with mutations in each gene. Details are listed in Table S5. (E) Schematic of the pathways affected by the (p)ppGpp0 suppressor mutations. GuaB, GuaA, and Gmk are enzymes in the GTP biosynthesis pathway. CodY is a pleiotropic transcription factor that is activated by GTP and activates transcription of guaB. The colors of the gene products match that of the genes in Figure 4D.
Figure 5
Figure 5. Decreased GTP Levels Allow Survival of Amino Acid Starvation
(A) Colony formation of WT ((p)ppGpp +), (p)ppGpp0 ((p)ppGpp −) and the indicated suppressor mutants on minimal medium. For this and subsequent panels, the colors denote the different genes that have mutations in the (p)ppGpp0 suppressors and are coded as in Figure 4D. (B) Percent survival of WT, (p)ppGpp0, and the indicated suppressor mutants upon amino acid starvation. Cells were treated with 0.5 mg/ml RHX for 40 minutes and then plated on LB. Percent survival was calculated as in Figure 4A. (C) GTP levels of WT, (p)ppGpp0, and the indicated suppressor mutants before and after treatment with 0.5 mg/ml RHX for 10 minutes were quantified by TLC and normalized to initial levels of ATP. (D) GTP levels are correlated with survival of amino acid starvation. Starvation-induced changes of GTP levels in the indicated suppressor mutants were obtained by TLC and plotted against % survival. Averages from three independent experiments are plotted for each suppressor allele. To assess correlation, the coefficient of determination (R2 value) was calculated. Strains are color coded as in Figure 4D. ◇: (p)ppGpp0; ■: codY, ○: guaA, ◆: guaB, and ▲: gmk suppressor alleles. (E) Starvation-induced changes of GTP levels of the indicated suppressor mutants are plotted against changes of ATP levels, similar to Figure 5D. (F) Starvation-induced changes of ATP levels of the indicated suppressor mutants were obtained by TLC and plotted against % survival, similar to Figure 5D.
Figure 6
Figure 6. High Levels of GTP Kill (p)ppGpp0 Cells Independent of Starvation
(A) Decreasing GTP levels by decoyinine (50 µg/ml) enhances colony formation of (p)ppGpp0 and ΔcodY (p)ppGpp0 cells on minimal medium. (B) Increasing GTP levels by guanosine (0.1 mM Guo) decreases colony formation of (p)ppGpp0 suppressors on minimal medium. WT, (p)ppGpp0, (p)ppGpp0 ΔcodY, guaB-65T>C (guaB), and gmk419C>T (gmk) mutants were plated on medium with or without 0.1 mM Guo. (C) (p)ppGpp0 cells do not survive Guo addition. WT and (p)ppGpp0 cells were grown in liquid medium with casamino acids, treated with 1 mM Guo, and then plated on LB plates at the indicated times after treatment. (D) Exponential phase cultures 30 minutes after treatment with 1 mM Guo are stained with the fluorescent dyes SYTO9 (green) and propidium iodide (red) to label live and dead cells, respectively. (E) A mutation in gmk, but not codY or guaB, enables (p)ppGpp0 cells to form colonies in the presence of Guo. WT, (p)ppGpp0, (p)ppGpp0 ΔcodY, (p)ppGpp0 guaB-65T>C (guaB), and (p)ppGpp0 gmk419C>T (gmk) mutants were plated on medium supplemented with 20 amino acids, with or without 0.1 mM Guo. (F) A mutation in gmk, but not codY and guaB, prevents high levels of GTP in (p)ppGpp0 cells. GTP levels for untreated or Guo-treated (1 mM, 20 minutes) samples were determined by TLC for the same strains as 6E.
Figure 7
Figure 7. (p)ppGpp governs starvation-sensing negative feedback control of GTP levels via direct enzymatic inhibition, thus preventing death
(p)ppGpp, produced from GTP(GDP) and ATP, directly inhibits the GTP biosynthesis enzymes HprT and Gmk to rapidly block de novo and salvage GTP biosynthesis. (p)ppGpp is induced (1) to low levels by increased GTP levels, to provide negative feedback control of GTP; and (2) to high levels by amino acid starvation, via activation of the main (p)ppGpp synthetase RelA, to decrease GTP levels. The regulation of GTP by (p)ppGpp is important for cell viability as high levels of GTP result in cell death.

References

    1. Artsimovitch I, Patlan V, Sekine S, Vassylyeva MN, Hosaka T, Ochi K, Yokoyama S, Vassylyev DG. Structural basis for transcription regulation by alarmone ppGpp. Cell. 2004;117:299–310. - PubMed
    1. Barker MM, Gaal T, Josaitis CA, Gourse RL. Mechanism of regulation of transcription initiation by ppGpp. I. Effects of ppGpp on transcription initiation in vivo and in vitro. J Mol Biol. 2001;305:673–688. - PubMed
    1. Beaman TC, Hitchins AD, Ochi K, Vasantha N, Endo T, Freese E. Specificity and control of uptake of purines and other compounds in Bacillus subtilis. J Bacteriol. 1983;156:1107–1117. - PMC - PubMed
    1. Belitsky BR, Sonenshein AL. CodY-Mediated Regulation of Guanosine Uptake in Bacillus subtilis. J Bacteriol. 2011;193:6276–6287. - PMC - PubMed
    1. Bowne SJ, Sullivan LS, Blanton SH, Cepko CL, Blackshaw S, Birch DG, Hughbanks-Wheaton D, Heckenlively JR, Daiger SP. Mutations in the inosine monophosphate dehydrogenase 1 gene (IMPDH1) cause the RP10 form of autosomal dominant retinitis pigmentosa. Hum Mol Genet. 2002;11:559–568. - PMC - PubMed

Publication types

MeSH terms

Associated data