. 2012 Oct 26;48(2):266-76.
doi: 10.1016/j.molcel.2012.08.007. Epub 2012 Sep 13.

Tet2 facilitates the derepression of myeloid target genes during CEBPα-induced transdifferentiation of pre-B cells

Affiliations

Tet2 facilitates the derepression of myeloid target genes during CEBPα-induced transdifferentiation of pre-B cells

Eric M Kallin et al. Mol Cell. .

Abstract

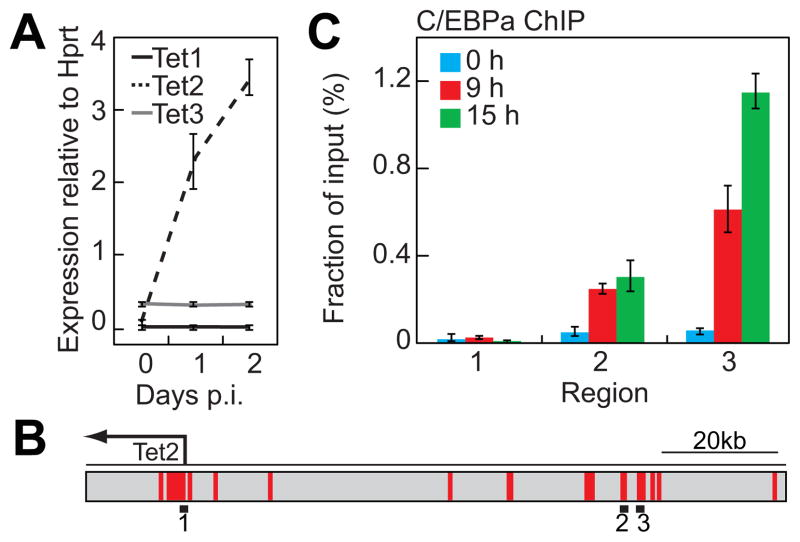
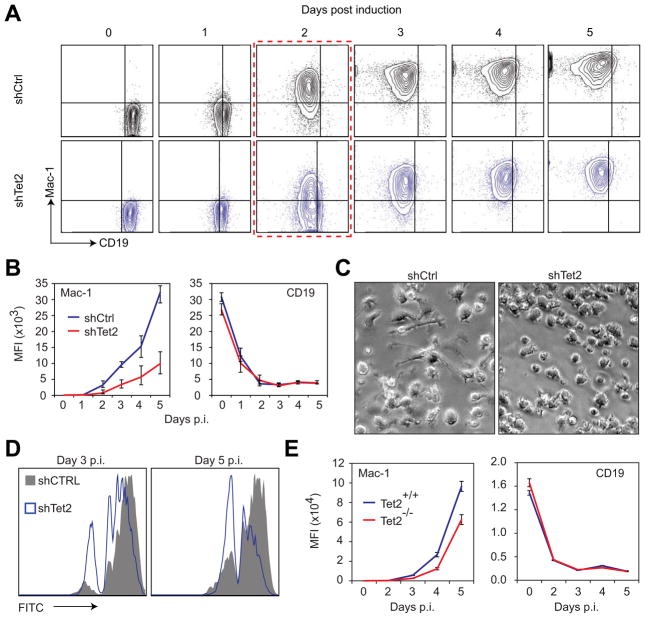
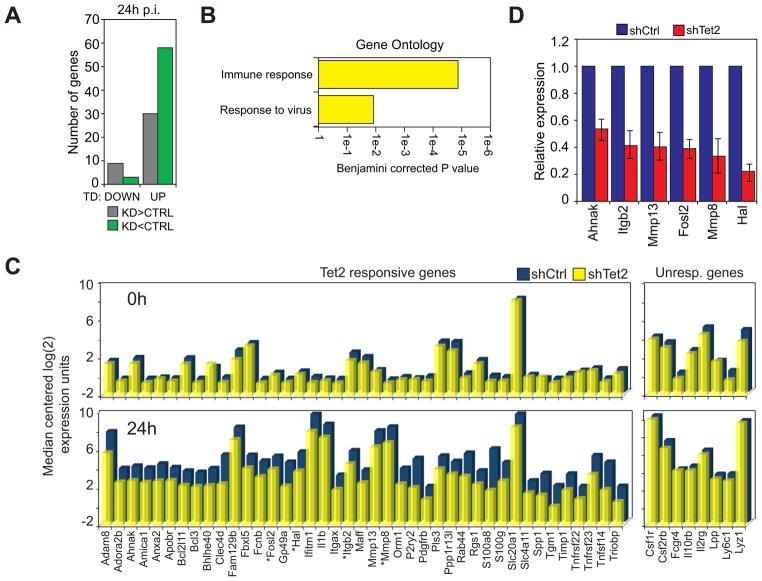
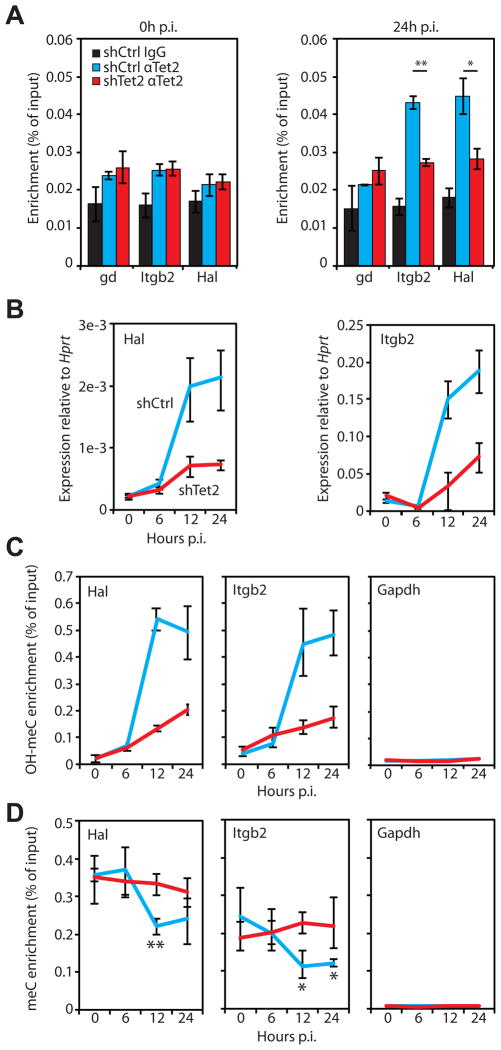
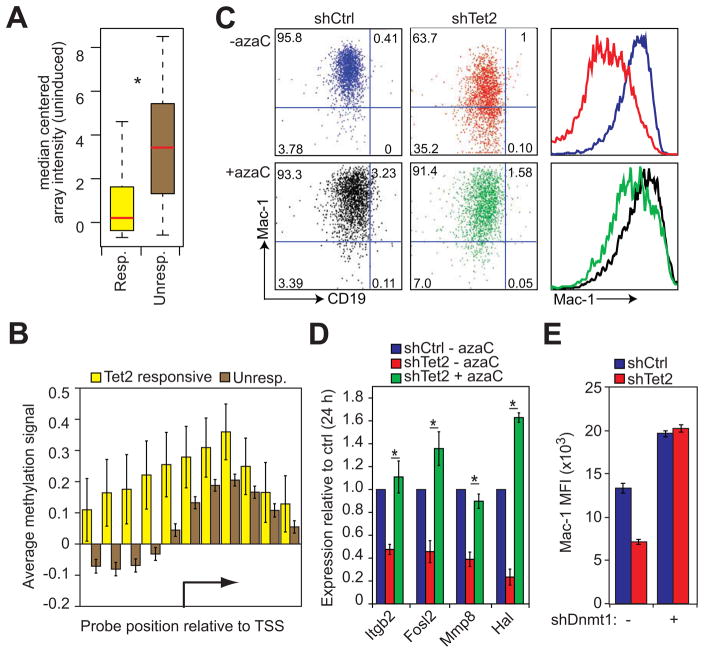
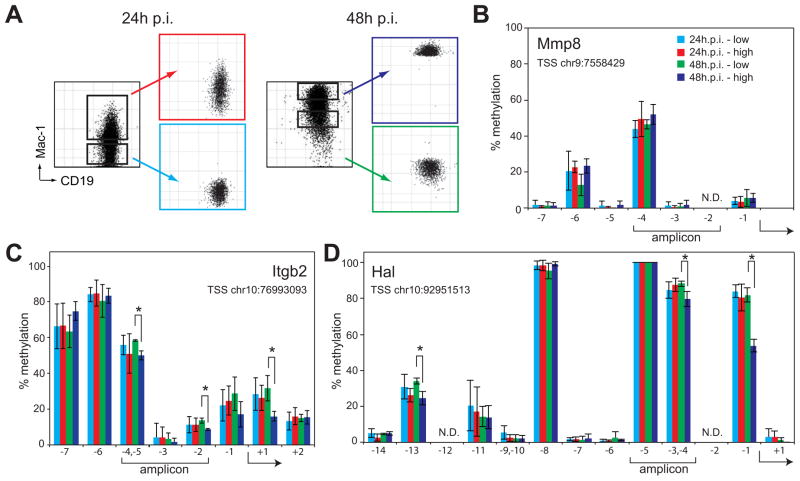
The methylcytosine hydroxylase Tet2 has been implicated in hematopoietic differentiation and the formation of myeloid malignancies when mutated. An ideal system to study the role of Tet2 in myelopoeisis is CEBPα-induced transdifferentiation of pre-B cells into macrophages. Here we found that CEBPα binds to upstream regions of Tet2 and that the gene becomes activated. Tet2 knockdowns impaired the upregulation of macrophage markers as well as phagocytic capacity, suggesting that the enzyme is required for both early and late stage myeloid differentiation. A slightly weaker effect was seen in primary cells with a Tet2 ablation. Expression arrays of transdifferentiating cells with Tet2 knockdowns permitted the identification of a small subset of myeloid genes whose upregulation was blunted. Activation of these target genes was accompanied by rapid increases of promoter hydroxy-methylation. Our observations indicate that Tet2 helps CEBPα rapidly derepress myeloid genes during the conversion of pre-B cells into macrophages.


Figures

Figure 1
Figure 1. C/EBPa induces Tet2 expression during B cell to macrophage transdifferentiation and binds to the Tet2 enhancer
A) qRT-PCR analysis of Tet1/2/3 expression levels in C10 cells. Data are presented relative to Hprt expression as mean ±SD of three biological replicates. B) Schematic representation of the Tet2 locus indicating the amplicons used for ChIP analysis (black bars). Regions highlighted in red represent highly conserved sequences between mouse and human (>60% conservation). C) ChIP assay demonstrating C/EBPa enrichment at Tet2 upstream regulatory regions during transdifferentiation. Data are presented as mean percentage of input ±SD of three biological replicates.
Figure 2
Figure 2. Disruption of Tet2 impairs B cell to macrophage transdifferentiation. See also Figure S1
A) FACS plots of CD19 (x-axis) and Mac-1 (y-axis) marker levels in control (shCtrl, black) and Tet2 kd (shTet2, blue) C10 cells at the indicated time points during transdifferentiation. Dotted red outline indicates the time-point where the percentage of Mac-1 positive cells was most inhibited in the Tet2 kd sample. B) Mac-1 (left panel) and CD19 (right panel) mean fluorescence intensity (MFI) of control (shCtrl, blue) and Tet2 kd (shTet2, red) cells at the indicated time points p.i. of transdifferenitation. Data are presented as mean ±SD of three biological replicates. C) Images of control (shCtrl) and Tet2 kd (shTet2) C10 cells taken 5 days after the induction of transdifferentiation. D) Histogram plot representation of the phagocytic capacity of control (shCtrl, dark grey) and Tet2 kd (shTet2, blue) C10 cells at day 3 and day 5 of transdifferentiation to engulf green fluorescent beads as determined by FACS analysis. The peaks represent cells that have not ingested particles (far left) to cells that have ingested one or more particles (subsequent peaks to the right). Data presented are representative of three biological replicates. E) Mac-1 (left panel) and CD19 (right panel) MFI as determined by FACS of wildtype (Tet2+/+, blue) and Tet2 null (Tet2−/−, red) cells at the indicated time p.i. of transdifferenitation. Data represent mean ±SD of three biological replicates.
Figure 3
Figure 3. Disruption of Tet2 impairs the upregulation of myeloid specific genes. See also Figure S2
A) Number of genes that are downregulated (DOWN) or upregulated (UP) during transdifferentiation and misexpressed at least 1.5 fold in Tet2 kd cells versus the control. Misexpressed genes are further subdivided into those that are expressed at higher levels in Tet2 kd cells (KD>CTRL, grey) and those that are expressed at lower levels in Tet2 kd cells (KD<CTRL, green). B) Top Biological Process ontology terms associated with genes upregulated during transdifferentiation and expressed lower in Tet2 kd cells when compared to controls. X-axis represents the Benjamini-corrected P value of ontology term enrichment. C) Bar plot of genes from the microarray that show a decreased expression upon Tet2 kd (Tet2 responsive genes) compared to selected genes not affected by Tet2 kd (Unresponsive genes). Median centered expression values are presented for the indicated gene (x-axis) in uninduced (0h) and 24h induced control cells (shCtrl, blue bars) and Tet2 knockdown cells (shTet2, yellow bars). Asterisks denote verified direct Tet2 target genes. D) qRT-PCR validation of several genes identified by microarray at 24h p.i.. Samples were normalized against Hprt and expression in Tet2 kd cells (shTet2, red bars) was set relative to that in control cells (shCtrl, blue bars). Data are presented as the mean ±SD of three biological replicates.
Figure 4
Figure 4. Tet2 binding to the promoters of selected genes results in OH-MeC accumulation. See also Figure S3
A) Tet2 binding at target gene promoters in 0h and 24h p.i. cells was analyzed by chromatin immunoprecipitation (ChIP) followed by qPCR. The experiment was carried out in control (shCtrl, blue bars) and Tet2 kd (shTet2, red bars) cells. Local background was determined through IgG experiments carried out in shCtrl samples (IgG, black bars). Data presented as mean percentage of input ±SD of three biological replicates. Student’s t-test P value between shCtrl and shTet2 replicates < 0.01 (*), < 0.001 (**). Gene desert region, gd. B) qRT-PCR analysis of Hal (left panel) and Itgb2 (right panel) gene expression in control (shCtrl, blue lines) and Tet2 kd (shTet2, red lines) cells induced to transdifferentiate for the time indicated on the x-axis. Data presented as mean expression relative to Hprt ±SD of three biological replicates. C) Hydroxymethyl-DIP (αOH-MeC) assays followed by qPCR were performed at the indicated gene promoters (Hal, Itgb2, Gapdh) in control and Tet2 kd (colored as in B) cells at 0, 6, 12, and 24h p.i. of transdifferentiation. Data presented as in A. D) Methyl-DIP (αMeC) assays followed by qPCR were performed at the indicated gene promoters (Hal, Itgb2, Gapdh) in control and Tet2 kd (colored as in B) cells at 0, 6, 12, and 24h p.i. of transdifferentiation. Data presented as in A. Asterisks indicate Student’s t-test P value between 0h and the indicated time in shCtrl cells < 0.05 (*), < 0.01 (**).
Figure 5
Figure 5. DNA methylation contributes to Tet2 target gene silencing. See also Figure S4
A) Box plot representation of median-centered gene expression (log2 expression units) in uninduced control cells for genes that are upregulated during normal transdifferentiation and either respond to Tet2 kd (Resp., yellow, n=58) or do not respond to kd (Unresp., brown, n=1447). Red line indicates the median expression value of each cohort. Asterisk denotes Kolmogorov-Smirnov test P=1.029e-12. B) Bar plot of average DNA methylation at the transcription start sites (TSS) of Tet2 responsive (yellow bars, n=58) and unresponsive genes (brown bars, n=1182) as determined by MethylCAP-chip assay. Data are presented as the mean normalized signal from a methyl-DNA binding domain pull down assay hybridized to promoter tiling arrays. Error bars represent ±SD between aligned probes within a given group. C) FACS plots of 48h p.i. pre-B cell to macrophage transdifferentiation of control (shCtrl) and Tet2 kd (shTet2) cells carried out with or without treatment with 5-azacytidine (+azaC, -azaC). Quadrant gates are set with respect to uninduced control cells. Mac-1 histogram plots (right panels) colored with respect to FACS plots. Data presented are representative of three biological replicates. D) qRT-PCR analysis of Tet2 target genes 24h p.i. in control cells (shCtrl – azaC, blue) and Tet2 kd cells with or without 5-azacytidine pretreatment (shTet2 + azaC, green; shTet2 – azaC, red). Data represented as mean ±SD of Hprt normalized expression set relative to shCtrl levels of three biological replicates. Asterisks indicate Student’s t-test P value < 0.05 between shTet2 kd +/− azaC. E) Bar plots of Mac-1 expression in control (shCtrl, blue bars) and Tet2 knockdown (shTet2, red bars) cells superinfected or not with a lentivirus containing an shDnmt1 knockdown construct. Data presented as mean ±SD of three biological replicates. Representative FACS plots are presented in Figure S4C.
Figure 6
Figure 6. Cytosines within selected Tet2 target gene promoters may become demethylated after induced transdifferentiation
A) FACS plots of C10 cells induced for 24 or 48h prior and after sorting into Mac-1 low and Mac-1 high populations. B–D) Percentage of individual modified cytosines at the Mmp8 (B), Itgb2 (C) and Hal (D) promoters as determined by Sequenom MassARRAY analysis at the indicated positions. X-axis depicts the position of analyzed cytosines with respect to the TSS of the gene and y-axis the percentage of methylation. Data represent mean ±SD of three biological replicates. Asterisks, Student’s t-test P value < 0.05 between Mac-1 high and Mac-1 low populations 48h p.i.; Brackets below the x-axis, position of the qPCR amplicons used for DNA immunoprecipitation and ChIP experiments in Fig. 4. The genomic coordinate of each TSS is given in the graph and the arrow indicates the relative location within the individual CpGs analyzed. CpGs that could not be analyzed, N.D. Color corresponds to the FACS plots shown in A. Chromosome position of the assayed region: Mmp8, chr9:7557999-7558511; Itgb2, chr10:76992548-76993258; Hal, chr10:92950958-92951420. Position data is relative to mouse genome build mm9.

References

    1. Adolfsson J, Mansson R, Buza-Vidas N, Hultquist A, Liuba K, Jensen CT, Bryder D, Yang L, Borge OJ, Thoren LA, et al. Identification of Flt3+ lympho-myeloid stem cells lacking erythro-megakaryocytic potential a revised road map for adult blood lineage commitment. Cell. 2005;121:295–306. - PubMed
    1. Bozec A, Bakiri L, Hoebertz A, Eferl R, Schilling AF, Komnenovic V, Scheuch H, Priemel M, Stewart CL, Amling M, et al. Osteoclast size is controlled by Fra-2 through LIF/LIF-receptor signalling and hypoxia. Nature. 2008;454:221–225. - PubMed
    1. Broske AM, Vockentanz L, Kharazi S, Huska MR, Mancini E, Scheller M, Kuhl C, Enns A, Prinz M, Jaenisch R, et al. DNA methylation protects hematopoietic stem cell multipotency from myeloerythroid restriction. Nat Genet. 2009;41:1207–1215. - PubMed
    1. Bussmann LH, Schubert A, Vu Manh TP, De Andres L, Desbordes SC, Parra M, Zimmermann T, Rapino F, Rodriguez-Ubreva J, Ballestar E, et al. A robust and highly efficient immune cell reprogramming system. Cell Stem Cell. 2009;5:554–566. - PubMed
    1. Chen T, Hevi S, Gay F, Tsujimoto N, He T, Zhang B, Ueda Y, Li E. Complete inactivation of DNMT1 leads to mitotic catastrophe in human cancer cells. Nat Genet. 2007;39:391–396. - PubMed

Publication types

MeSH terms

Associated data