. 2012 Dec 10;318(20):2604-15.
doi: 10.1016/j.yexcr.2012.09.002. Epub 2012 Sep 12.

An indirect role for oncomir-519b in the expression of truncated neurokinin-1 in breast cancer cells

Affiliations

An indirect role for oncomir-519b in the expression of truncated neurokinin-1 in breast cancer cells

Peter Navarro et al. Exp Cell Res. .

Abstract

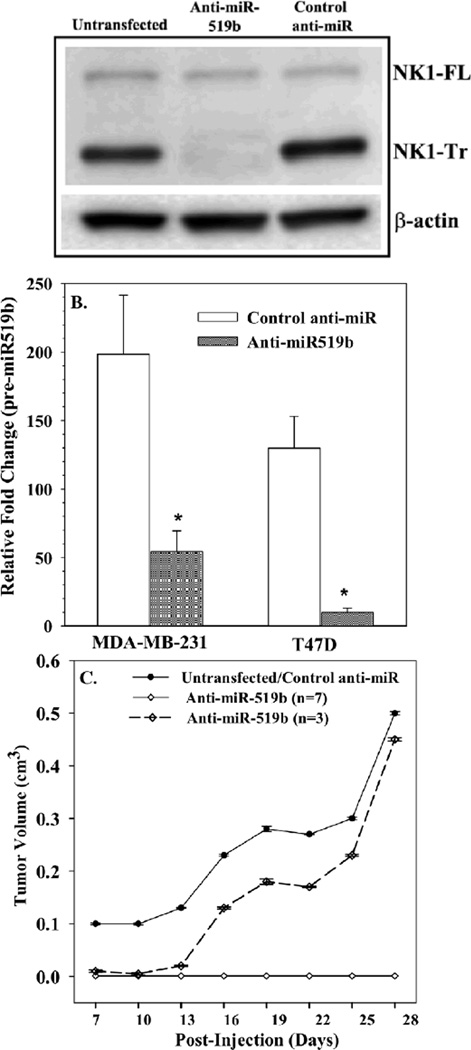
Neurokinin 1 (NK1) encodes full-length (NK1-FL) and truncated (NK1-Tr) receptors, with distinct 3' UTR. NK1-Tr exerts oncogenic functions and is increased in breast cancer (BC). Enhanced transcription of NK1 resulted in higher level of NK1-Tr. The 3' UTR of these two transcripts are distinct with NK1-Tr terminating at a premature stop codon. NK1-Tr mRNA gained an advantage over NK1-FL with regards to translation. This is due to the ability of miR519B to interact with sequences within the 3' UTR of NK1-FL, but not NK1-Tr since the corresponding region is omitted. MiR519b suppressed the translation of NK1-FL in T47D and MDA-MB-231 resulting in increased NK1-Tr protein. Cytokines can induce the transcription of NK1. However, our studies indicated that translation appeared to be independent of cytokine production by the BC cells (BCCs). This suggested that transcription and translation of NK1 might be independent. The findings were validated in vivo. MiR-519b suppressed the growth of MDA-MB-231 in 7/10 nude BALB/c. In total, increased NK1-Tr in BCCs is due to enhanced transcription and suppressed translation of NK1-FL by miR-519b to reduced tumor growth. In summary, we report on miRNA as a method to further regulate the expression of a spiced variant to promote oncogenesis. In addition, the findings have implications for therapy with NK1 antagonists. The oncogenic effect of NK1-Tr must be considered to improve the efficacy of current drugs to NK1.


Conflict of interest statement

Conflict of Interest

The authors declare no conflict of interest

Figures

Fig. 1
Fig. 1. Nuclear run-on and Real-time RT-PCR for NK1 subtypes
(A) A non-radioactive method quantitated NK1-FL and NK-Tr. Fibroblast 1502 was stimulated with 10 ng/mL IL-1α or vehicle for 8 h. Nuclei were isolated and total RNA collected within a 24 h period for hybridization with cDNA probes and fluorochrome YoYo-1. The incorporated YoYo-1 was detected with a fluorometer. The results are presented as fluorescence intensity, mean±SD, n=7. (B) Real time was performed with primers that can discriminate NK1-FL and NK1-Tr with cDNA from IL-1α-stimulated fibroblasts. Control contained vehicle (PBS). The lowest value was normalized as 1 and the other experimental points were presented as relative fold change (mean±SD, n=4) as described [22]. * p<0.05 vs. IL-1α stimulated cells; ** p<0.05 vs. NK1-Tr; *** p<0.05 vs. NK1-Tr
Fig. 2
Fig. 2. Nuclear run-on, real-time RT-PCR and western blots for NK1 subtypes in BCCs
(A) Unstimulated T47D and MDA-MB-231 were studied for NK1-FL and NK1-Tr using the nuclear run-on assay as for Fig. 1A. The results are presented as the mean fluorescence intensity±SD, n=4. (B) Total cell extracts from T47D and MDA-MB-231 were studied for NK1 subtypes by western blots. (C) Normalized band densities for NK1-FL and NK1-Tr, n=3±SD. (D) Real-time was performed for NK1-FL and NK1-Tr as for Figure 1B. The lowest value was normalized as 1 and the other experimental points were presented as relative fold change (mean±SD, n=4) as for Fig. 1D. * p<0.05 vs. NK1-FL
Fig. 3
Fig. 3. MiR519b and miR609 levels in BCCs
(A) Shown are the 3′ UTR of NK1 (Tr and Fl) and the relative positions of miR519 and miR609. (B) Real-time PCR was performed for miR-519b and miR-609 with cDNA from T47D and MDA-MB-231. The data are presented as the relative fold change (mean±SD, n=5).
Fig. 4
Fig. 4. Effects on reporter gene activity by pre-miR-519b and -miR609
MDA-MB-231 and T47D were co-transfected with pMIR/NK1-SR (Figure S4) and pre-miR-519b (A) or pre-miR-609 (B). After 48 h luciferase activities were quantitated with whole cell extracts and the results are presented as the mean±SD, n=6. * p<0.05 vs. pre-miR-transfectants. (C) BCCs were transfected with pre-miR519b and/or anti-miR519b. Controls were transfected with control pre-miR. After 48 h, real-time PCR was performed for pre-miR519b and the data presented as fold change (mean±SD, n=4) of the lowest value, which was assigned a value of 1. (D) The studies in A and B were repeated, except with co-transfection with pre- and/or anti-miR519b. Parallel cultures were transfected with control pre-miR. After 48 h, luciferase activities were quantitated and the results are presented as for A and B’ (mean±SD, n=4).
Fig. 5
Fig. 5. MiRNAs in the expression of NK1 subtypes
(A) MDA-MB-231 was transfected with pre-miR609, -miR519b or control pre-miR. After 24 h, whole cell extracts were studied for NK1 subtypes by western blots. The membranes were stripped and reprobed with anti-β-actin. (B) The band densities in `A’ were normalized and the data from three different western blots are presented as the ratio of NK1-Tr/NK1-FL, mean±SD. MDA-MB-231 and T47D were transfected with anti-miR519b and then analyzed as for `A’. (C) MDA-MB-231 and T47D were transfected with anti-miR519b and then analyzed as for `A’. (D) The band densities in `B’ were normalized and the data from three different western blots are presented as for `B’. * p>0.05 vs. control; *** p<0.01 vs. anti-miR519
Fig. 6
Fig. 6. Effects of anti-miR-519b on tumor growth
MDA-MB-231 cells were transfected with anti-miR519b or control anti-miR. The transfectants were validated by western blot for NK1-Tr (A) and real-time PCR for pre-miR519b (B). (C) Nude BALB/c (n=10) were injected with 106 cells, subcutaneously in the dorsal flank. The tumor volumes, presented as mean±SD. The experimental group (anti-miR519b) were plotted as those with no palpable tumor (n=7) and those with tumor growth (n=3). *p<0.05 vs. control anti-miR
Fig. 7
Fig. 7. Overall summary
Shown is an overall summary with other studies showing cytokine-mediated transcription of NK1 (*[14]). Cytokine production in BCCs, via autocrine stimulation, can induce NK1 transcription (*[5,15]) to produce NK1-FL and NK1-Tr. Mir-519b interact with NK1-FL to suppress its translation, thereby allowing for increased NK1-Tr. Since miR-519b can suppress the RNA-binding protein, HuR (**[19]), perhaps there is another mechanism in the suppression of NK1-FL translation.

Similar articles

Cited by

References

    1. Jemal A, Siegel R, Xu J, Ward E. Cancer Statistics, 2010. CA Cancer J Clin. 2010;61:133–134. - PubMed
    1. Munoz M, Rosso M, Covenas R. A new frontier in the treatment of cancer: NK-1 receptor antagonists. Curr Med Chem. 2010;17:504–516. - PubMed
    1. Brener S, Gonzalez-Moles MA, Tostes D, Esteban F, Gil-Montoya JA, Ruiz-Avila I, Bravo M, Munoz M. A role for the substance P/NK-1 receptor complex in cell proliferation in oral squamous cell carcinoma. Anticancer Res. 2009;29:2323–2329. - PubMed
    1. Reddy BY, Greco SJ, Patel PS, Trzaska KA, Rameshwar P. RE-1-silencing transcription factor shows tumor-suppressor functions and negatively regulates the oncogenic TAC1 in breast cancer cells. Proc Natl Acad Sci. 2009;106:4408–4413. - PMC - PubMed
    1. Patel HJ, Ramkissoon SH, Patel PS, Rameshwar P. Transformation of breast cells by truncated neurokinin-1 receptor is secondary to activation by preprotachykinin-A peptides. Proc Natl Acad Sci. 2005;102:17436–17441. - PMC - PubMed

Publication types