. 2012 Dec 7:314:182-91.
doi: 10.1016/j.jtbi.2012.08.038. Epub 2012 Sep 8.

Bayesian statistical analysis of circadian oscillations in fibroblasts

Affiliations

Bayesian statistical analysis of circadian oscillations in fibroblasts

Andrew L Cohen et al. J Theor Biol. .

Abstract

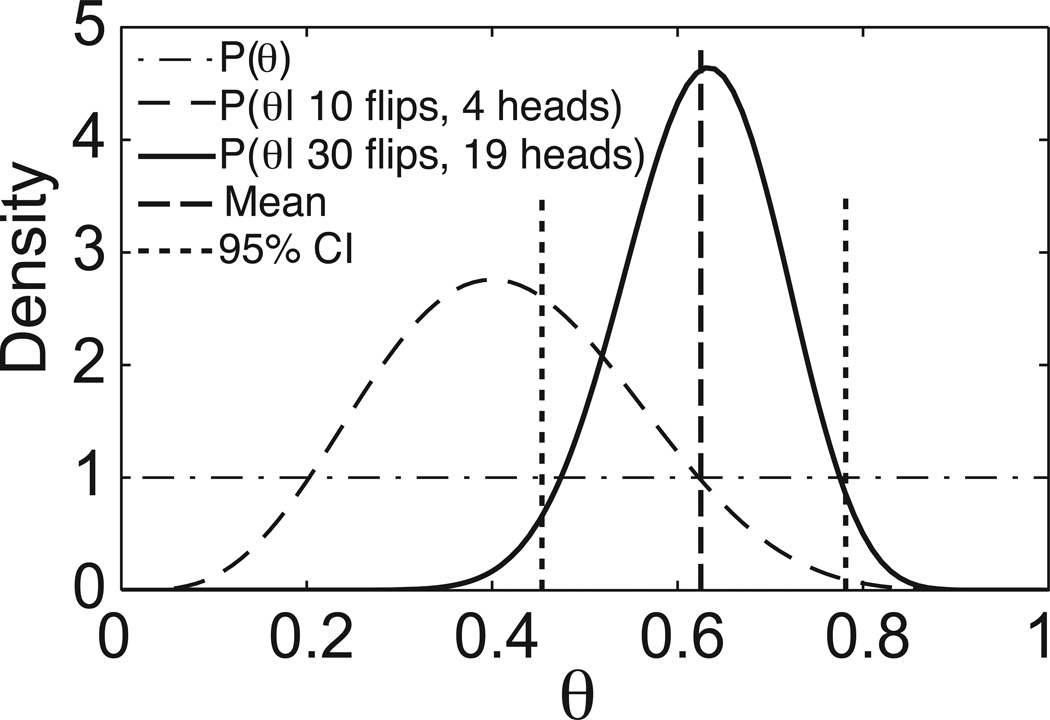
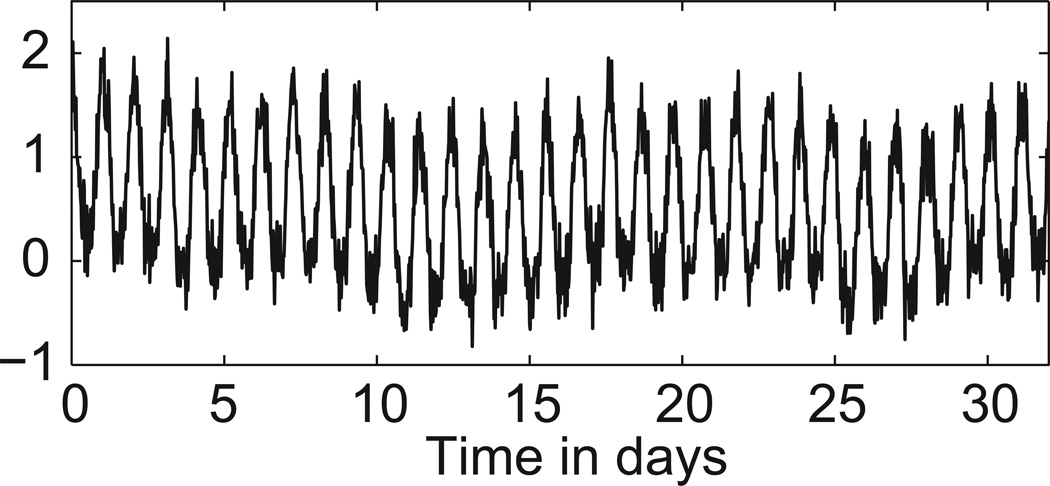
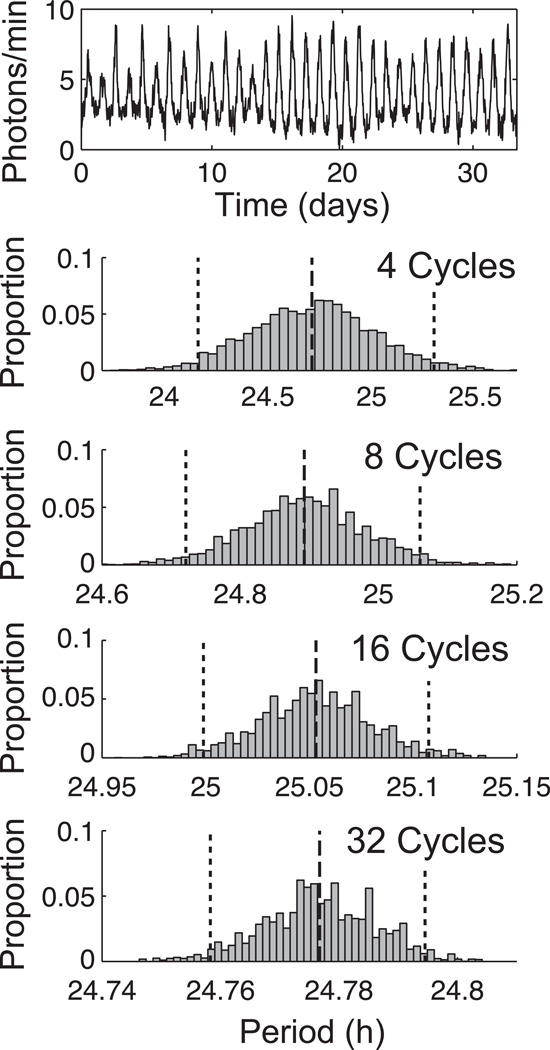
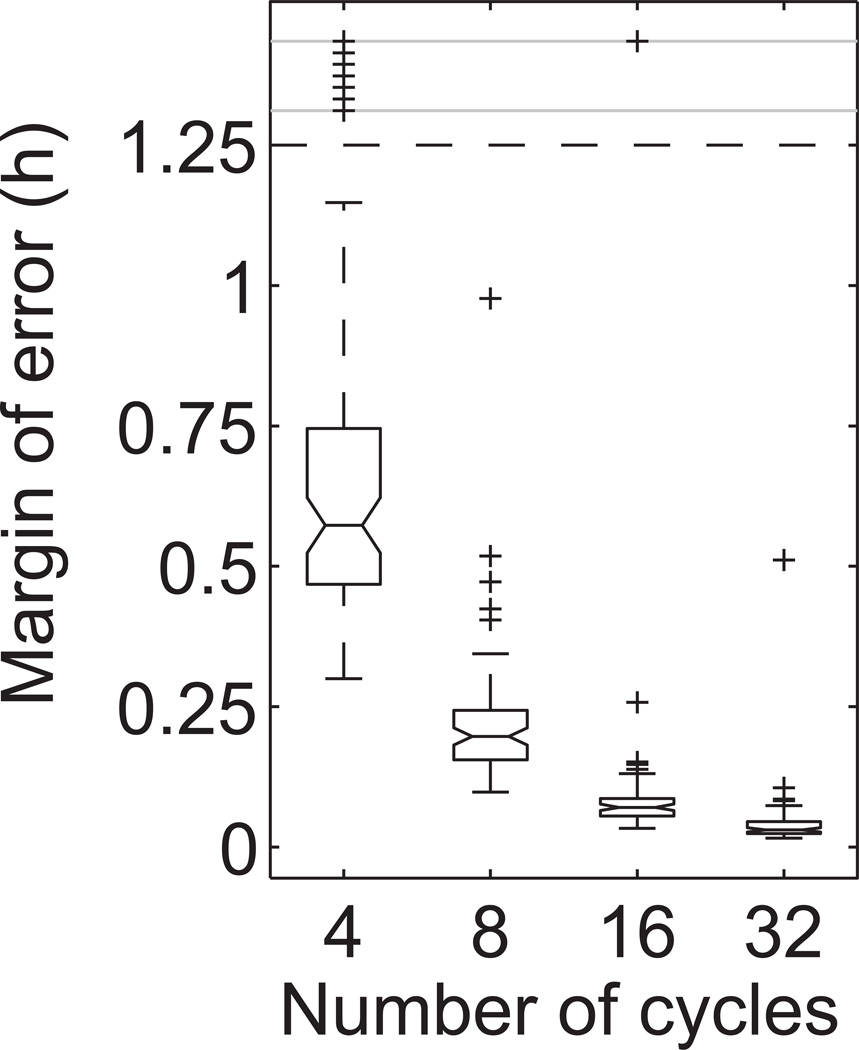
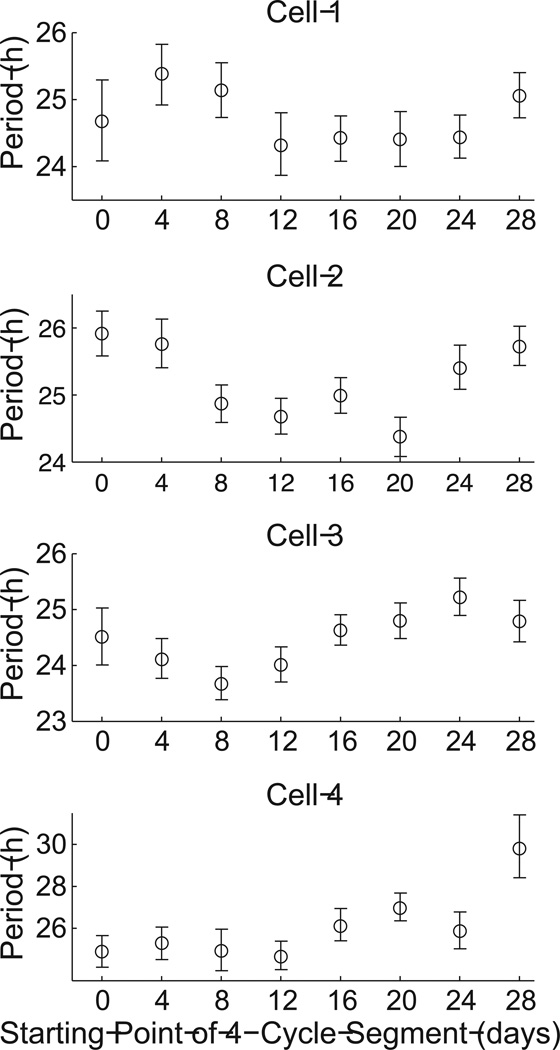
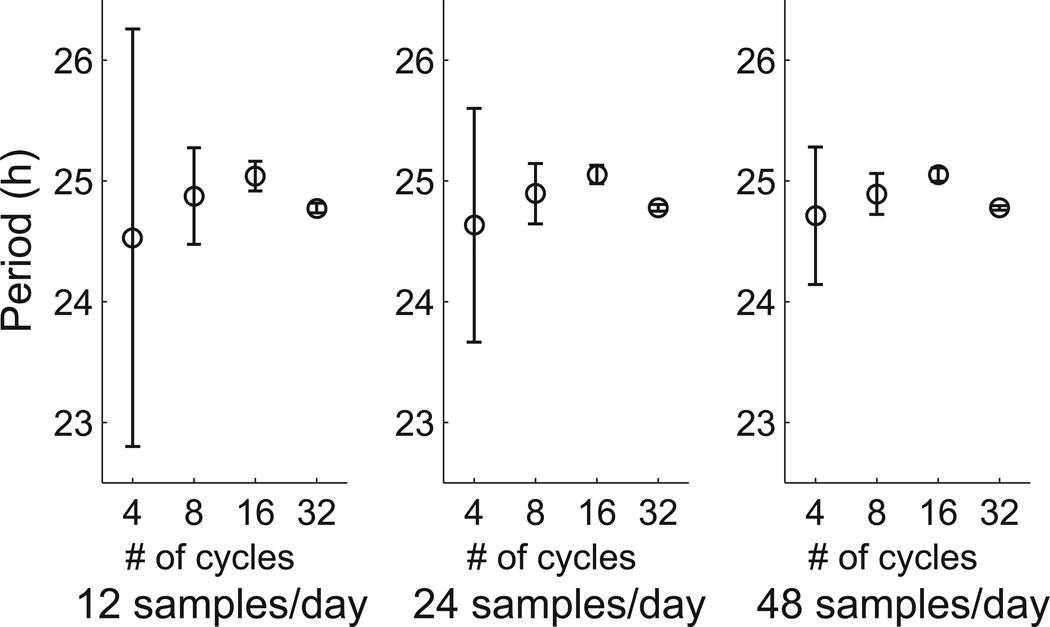
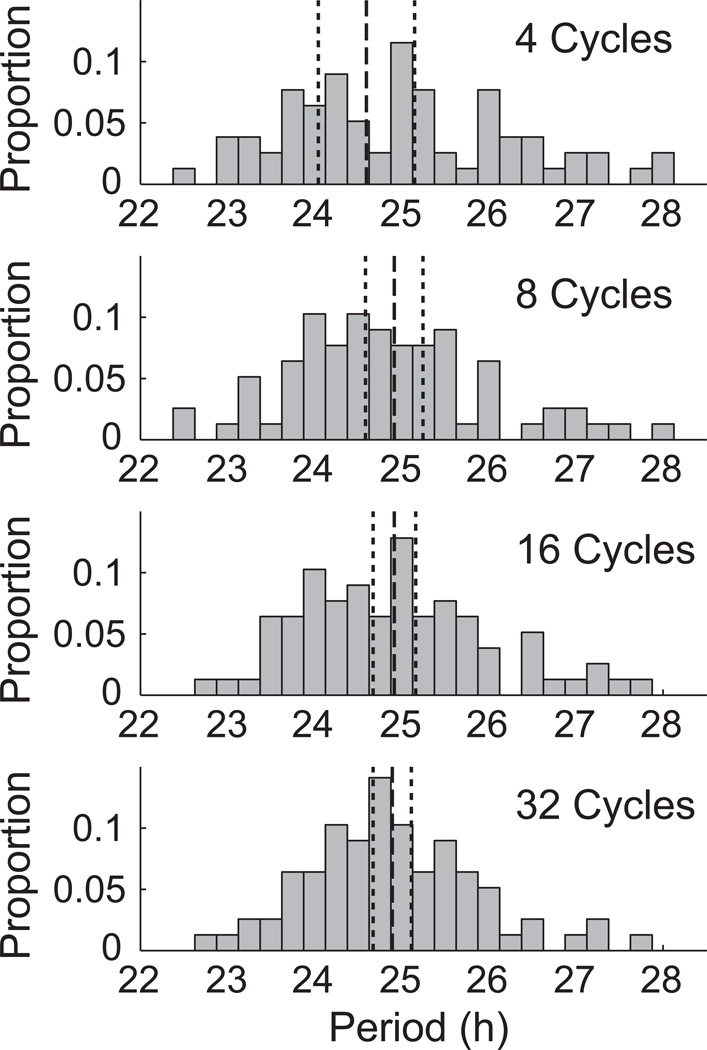
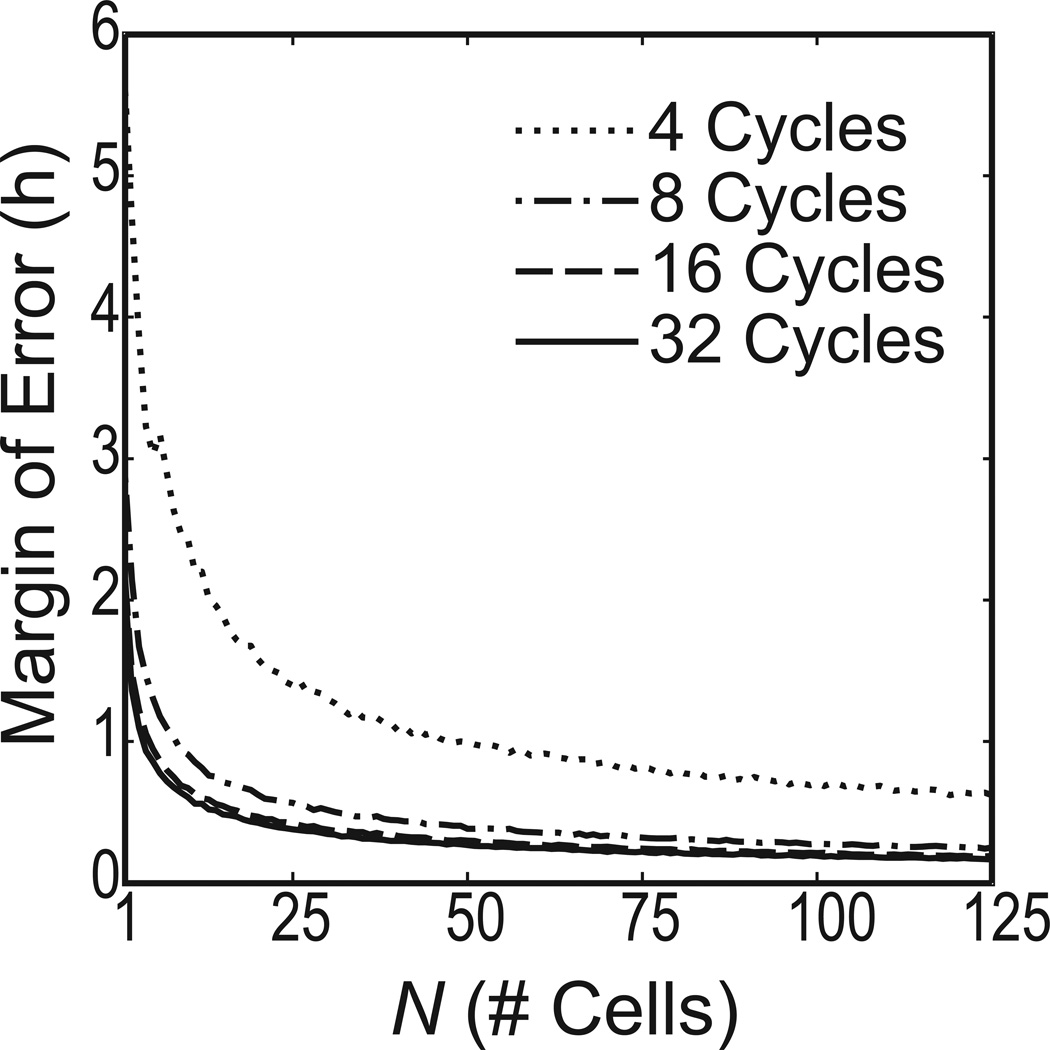
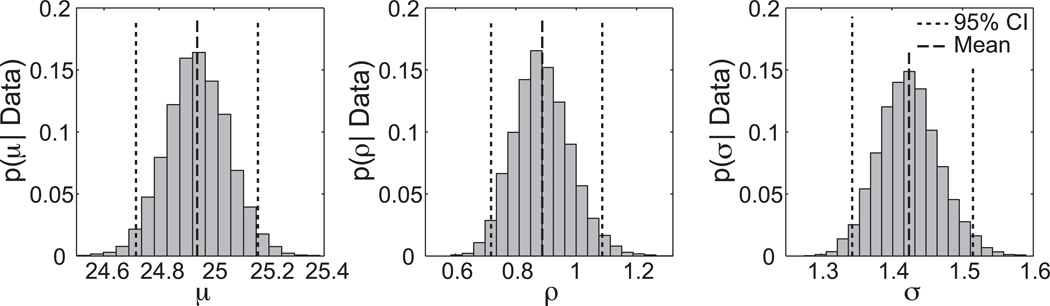
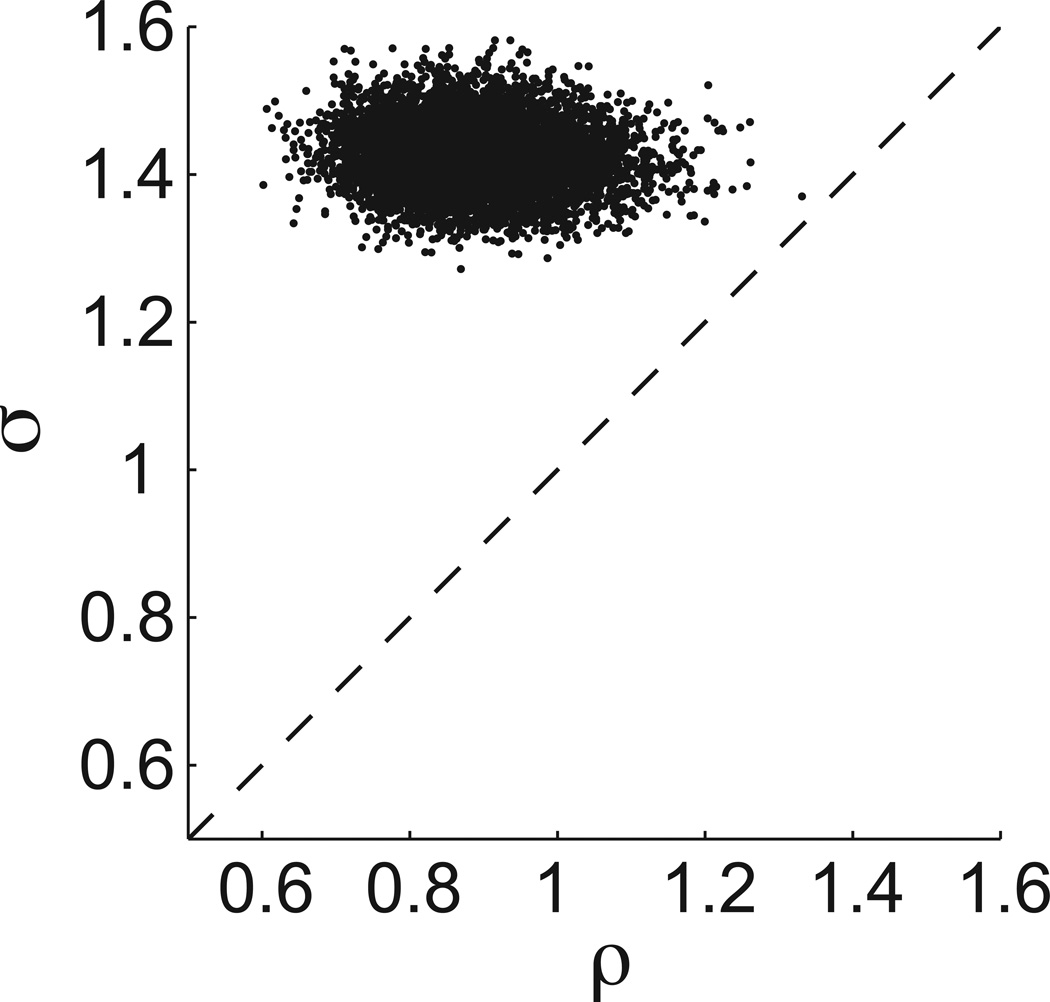
Precise determination of a noisy biological oscillator's period from limited experimental data can be challenging. The common practice is to calculate a single number (a point estimate) for the period of a particular time course. Uncertainty is inherent in any statistical estimator applied to noisy data, so our confidence in such point estimates depends on the quality and quantity of the data. Ideally, a period estimation method should both produce an accurate point estimate of the period and measure the uncertainty in that point estimate. A variety of period estimation methods are known, but few assess the uncertainty of the estimates, and a measure of uncertainty is rarely reported in the experimental literature. We compare the accuracy of point estimates using six common methods, only one of which can also produce uncertainty measures. We then illustrate the advantages of a new Bayesian method for estimating period, which outperforms the other six methods in accuracy of point estimates for simulated data and also provides a measure of uncertainty. We apply this method to analyze circadian oscillations of gene expression in individual mouse fibroblast cells and compute the number of cells and sampling duration required to reduce the uncertainty in period estimates to a desired level. This analysis indicates that, due to the stochastic variability of noisy intracellular oscillators, achieving a narrow margin of error can require an impractically large number of cells. In addition, we use a hierarchical model to determine the distribution of intrinsic cell periods, thereby separating the variability due to stochastic gene expression within each cell from the variability in period across the population of cells.


Figures

Figure 1
Figure 1
Coin-flip illustration of Bayesian statistical concepts. In this example, the prior probability distribution P(θ) is the uniform distribution on [0,1], and P(θ | 10 flips, 4 heads) is the posterior distribution resulting from the experiment that yielded 4 heads out of 10 coin flips. The posterior P(θ | 30 flips, 19 heads) was computed using the experimental outcomes of a total of 30 flips, and is shown as a solid curve with the mean as a dashed vertical line and the 95% CI indicated with dotted vertical lines.
Figure 2
Figure 2
Example of simulated noisy oscillatory time series used to test the 7 period estimation methods.
Figure 3
Figure 3
Application of the BPENS period estimation method to Fibroblast #57, whose time series is shown at the top, using 4, 8, 16, or 32 cycles. Each histogram displays the computed posterior distribution for the period, with 95% CIs indicated by dotted lines and the mean value by a dashed line. The width of the CIs reflects the uncertainty of the period estimate. Note that as the number of cycles increases, the range of the horizontal axis greatly decreases.
Figure 4
Figure 4
Box plot of the margins of error for the fibroblast time series versus the number of cycles in the time series. Median margins of error are 0.57h, 0.20h, 0.071h, and 0.031h for 4, 8, 16, and 32 cycles, respectively. Plus signs indicate outliers.
Figure 5
Figure 5
Estimated period for 4-cycle segments of four fibroblast time series starting at different time points, revealing variability in estimated period over time. Cells 1–4 are Fibroblasts #57, #25, #44, and #65, respectively (Leise et al., 2012). Error bars show 95% CIs and the mean is marked with a circle.
Figure 6
Figure 6
Effect of the number of cycles and sampling rate on the uncertainty in the BPENS period estimate for Fibroblast #57. Error bars are 95% CIs with the mean marked. The margin of error decreases as the number of cycles and the sampling rate increase.
Figure 7
Figure 7
Histograms with 15 min bins showing the estimated mean fibroblast periods using the BPENS method. Dashed lines indicate the mean value of the mean periods for 78 fibroblast time series; the dotted lines give the 95% CIs for the mean of the mean periods. 7 outliers in the 4 cycles histogram and 3 outliers in the 8 cycles histogram are not shown.
Figure 8
Figure 8
The number of cells (N) required to achieve the desired margin of error for the mean period of the population, given the number of cycles recorded (using 48 samples/day). The margin of error decreases as the reciprocal of the square root of the number of cells.
Figure 9
Figure 9
Hierarchical modeling of the 78 fibroblasts. The dashed lines mark the mean values and the dotted lines indicate the 95% CIs for the parameters μ (mean period of the population), ρ (standard deviation of periods across the population), and σ (standard deviation in cycle length for each cell).
Figure 10
Figure 10
Scatter plot of 8,000 samples drawn from the joint distribution of ρ and σ. The between-cells variability ρ is less than the within-cell variability σ for the set of 78 fibroblasts.

References

    1. Andrieu C, Doucet A. Joint Bayesian model selection and estimation of noisy sinusoids via reversible jump MCMC. IEEE Transactions on Signal Processing. 1999;47:2667–2676.
    1. Andrieu C, N DF, Doucet A, Jordan MI. An introduction to MCMC for machine learning. Machine Learning. 2003;50:5–43.
    1. Bell-Pedersen D, Cassone V, Earnest D, Golden S, Hardin P, Thomas T, Zoran M. Circadian rhythms from multiple oscillators: Lesson from diverse organisms. Nat Rev Genet. 2005;6:544–556. - PMC - PubMed
    1. Bretthorst GL. Bayesian Spectrum Analysis and Parameter Estimation (Lecture Notes in Statistics 48) Berlin: Springer; 1988.
    1. Chib S, Greenberg E. Understanding the Metropolis--Hastings algorithm. The American Statistician. 1995;49:327–335.

Publication types

LinkOut - more resources