. 2012 Oct;15(10):1445-53.
doi: 10.1038/nn.3215. Epub 2012 Sep 16.

Path integration: how the head direction signal maintains and corrects spatial orientation

Affiliations

Path integration: how the head direction signal maintains and corrects spatial orientation

Stephane Valerio et al. Nat Neurosci. 2012 Oct.

Abstract

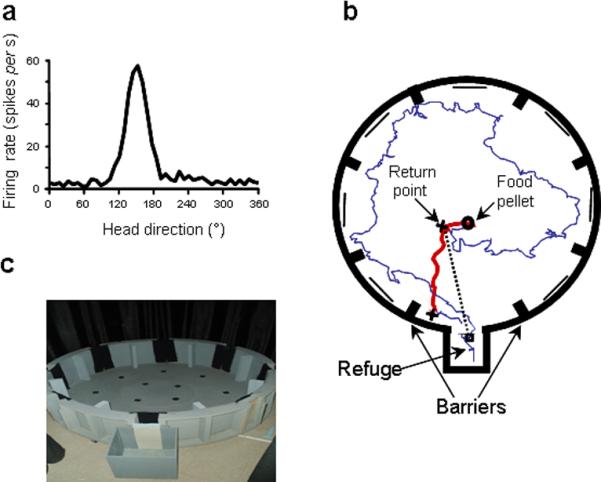
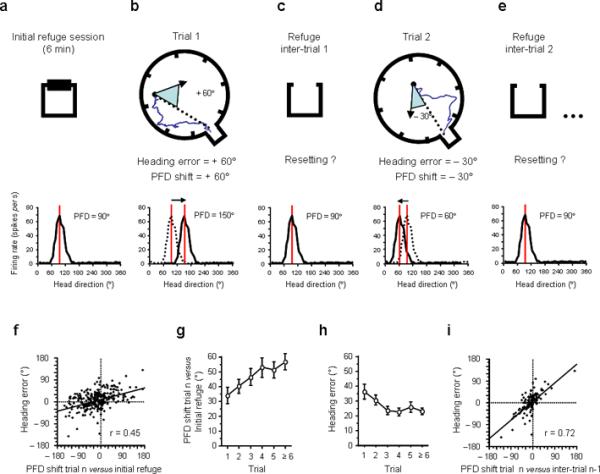
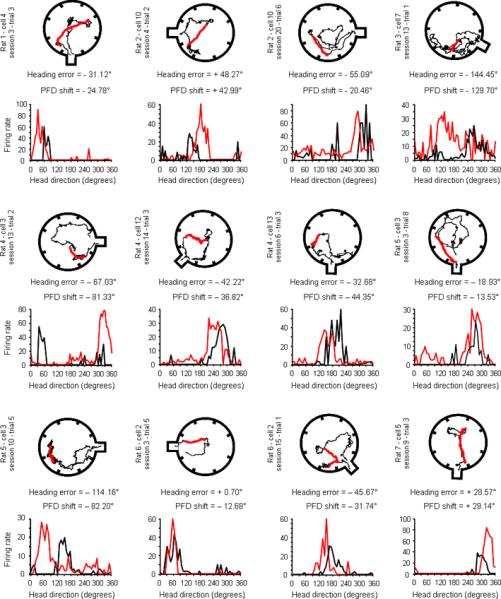
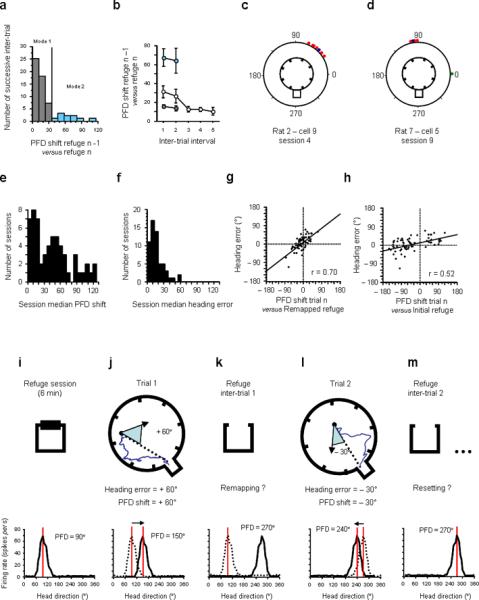
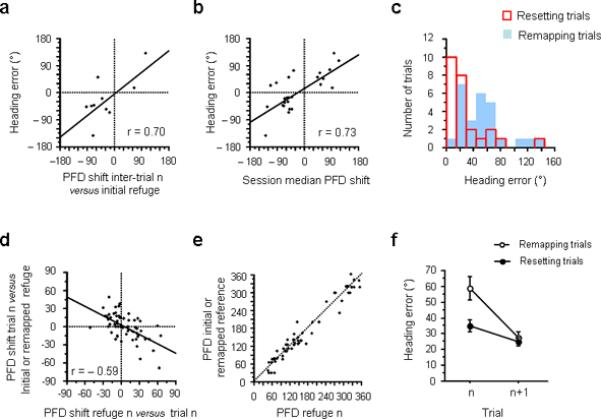
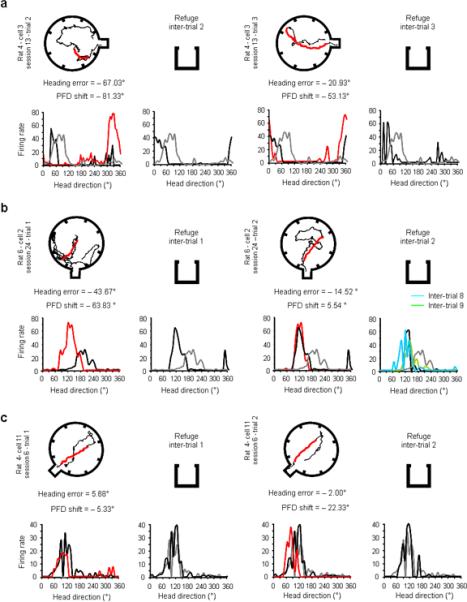
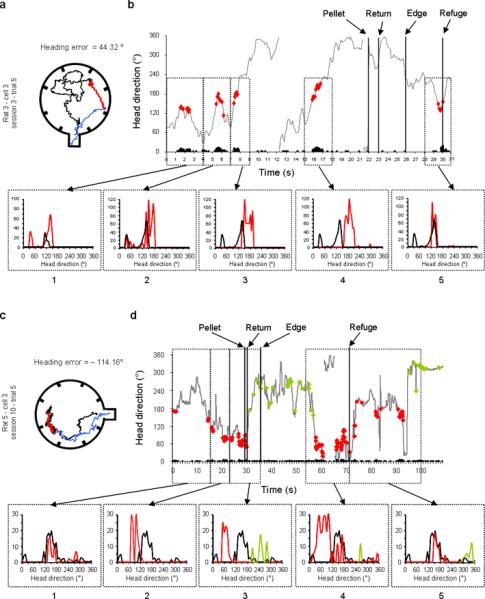
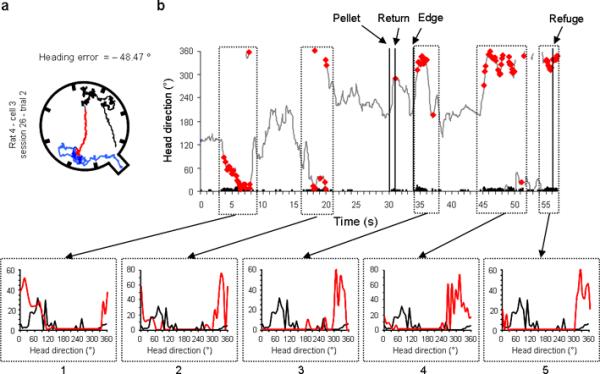
Head-direction cells have frequently been regarded as an internal 'compass' that can be used for navigation, although there is little evidence showing a link between their activity and spatial behavior. In a navigational task requiring the use of internal cues to return to a home location without vision (path integration), we found a robust correlation between head-direction cell activity and the rat's heading error in the rat's homing behavior. We observed two different correction processes that rats used to improve performance after an error. The more frequent one consists of 'resetting' the cell whenever the rat returns to the home location. However, we found that when large errors occur, the head-direction system has the ability to 'remap' and set a new reference frame, which is then used in subsequent trials. We also offer some insight into how these two correction processes operate when rats make an error.


Figures

Figure 1
Figure 1
a, Example of a HD cell tuning curve (8 min. session in the cylinder, PFD = 150°). b, Example of path taken by a rat: the foraging (outward) trip (in blue) ends when the animal finds the food pellet. The heading of the return trip (in red) was measured from the return point (1st cross) to the edge of the arena (2nd cross). c, The food-carrying task apparatus.
Figure 2
Figure 2
Hypothesized relationship between the PFD shift and the rat's heading error. a–e, Two consecutive trials are depicted in a–e, with inter-trial intervals in the refuge (a, c, e) in between each foraging trial (b, d). Beneath each figure are firing rate vs. HD plots of a hypothetical HD cell, which has a PFD of 90° in the refuge. If the heading error of the animal on its return trip is +60° (b, blue triangle) the PFD recorded at the same time (trial 1) should show a +60° shift (PFD value: 150°) compared to the initial refuge value (dashed line in b, bottom row). Previous theories suggested that a resetting of the cell's PFD would occur after each trip when the animal returns to the refuge (in c and e the cell's PFD shifts back to the initial refuge value: 90°). f, Heading error as a function of the cell's PFD shift from its initial value in the refuge. g, Mean PFD shift between trial n and the initial refuge value as a function of the trial number in the session. h, Heading error as a function of the trial number in the session. i, Heading error as a function of PFD shift on trial n compared to the previous inter-trial interval (n-1). All error bars indicate s.e.m.
Figure 3
Figure 3
Examples of the foraging path with the corresponding tuning curve of a HD cell recorded during that trial. In each of these twelve examples, the return path of the animal, which was used to calculate its mean heading error, is shown in red. The cell's tuning curve recorded during the entire foraging trip is shown underneath in red and can be compared with the preceding inter-trial interval tuning curve (in black).
Figure 4
Figure 4
a, Distribution of all PFD shifts between successive refuge periods across all trials. b, PFD shift between successive refuge periods within a session (open circles). For inter-trial intervals 1 and 2, mode 1 trials (resetting, grey circles) and mode 2 trials (remapping, blue circles) are separated from one another. There were no mode 2 inter-trial PFD shifts observed for inter-trial intervals 3–5. Mode 2 inter-trial intervals (PFD shift > 35°, remapping) are represented in blue. c, Circular histogram of PFD shifts showing an example of a session where the cell's PFD remapped after the first trial (blue dot). The cell's PFD shifted + 51.2° from the initial refuge value (represented by zero). The PFD shifts on the following trials (red dots) are all clustered around the remapped value, indicating that subsequent PFD shifts were all reset to the new remapped value rather than the original refuge value. d, Circular histogram of PFD shifts showing an example of a session where the cell's PFD initially reset to the refuge on the first trial (green dot) and then remapped after the second trial (blue dot) and then maintained this new value in all the following trials (red dots). e, Distribution of the session median PFD shifts (from the initial refuge value). f, Distribution of the session median heading errors. g–h, Heading error as a function of the cell's PFD shift from its remapped refuge value (g) and from its initial refuge value (h). Note that the correlation is higher and contains a steeper slope for the remapped refuge values. i–m, Schematic of the remapping hypothesis. Similar to Figure 2a–e, the sequential behavioural episodes are represented in the first row. Beneath each figure are firing rate vs. HD plots of a hypothetical HD cell. i, In the initial refuge the cell's PFD is 90°. If the heading error of the animal on its return trip is +60° (j, blue triangle) the PFD recorded at the same time (trial 1) should show a +60° shift (PFD value: 150°) compared to the initial refuge value (dashed line in j, bottom row). In k, the cell's PFD does not return to its initial refuge value, but remaps to a random PFD (e.g. 270°). In l, the remapped PFD is the new reference and the amount the PFD will shift during trial 2 is compared to that remapped value (− 30°). Thus, the amount the PFD shifts from the new remapped PFD value (− 30° to 240°) predicts the heading error (− 30°) of the animal. m, in the following inter-trial interval, the PFD resets to the value established after remapping (270°). The data partially confirm this remapping hypothesis. One important difference is that the value of the remapped PFD is not random like that shown in k, but is influenced by the shift observed in the previous foraging trip. In this case (j), the remapped value would be ~150°.
Figure 5
Figure 5
The correction process. a, Heading error as a function of the cell's PFD shift between the current inter-trial interval and the initial refuge (Mode 2 inter-trials). b, Heading error observed in remapping trials, as a function of the session median PFD shift compared to its initial refuge value. c, Distribution of heading errors for resetting (red) and remapping (blue) trials. d, PFD shift in trial n (compared to initial or remapped refuge value) as a function of the PFD shift between trial n and the following inter-trial interval (refuge n). e, PFD recorded during the inter-trial interval n compared to the initial or remapped refuge value. f, Comparison of heading errors made by the animals before (trial n) and after (trial n+1) remapping (white dots) and resetting (black dots).
Figure 6
Figure 6
Examples of remapping (a–b) and resetting sessions (c). Each pair of rows depicts successive behavioural trials in a single session, along with the responses of a HD cell recorded during the trial. Similar to Figure 4, columns 1 and 3 show examples of foraging paths (outbound trips in black, return trips in red) above the firing rate vs. HD tuning curves recorded during the same trial (red trace), as well as the cell's response in the preceding refuge episode (black traces). Columns 2 and 4 show the cell's tuning curve during the inter-trial interval after the foraging trial (black traces). To illustrate the changes of the cell's PFD in the refuge after remapping, the HD cell's response during the initial refuge period is shown for all plots as the grey trace. Column 4 shows the cell's response during the following inter-trial interval(s) in the refuge after the foraging trial shown in column 3 (black trace). a, In this session, remapping occurs during trial 2. After shifting −81.33° during the second trial (compare red and black traces, column 1), the cell's PFD in the refuge during the next inter-trial interval (column 2) does not return to its initial refuge value (compare black and grey traces), but remains close to the value it had during the foraging trip (in this case trial 2). Note that in the following foraging trip (column 3) the shift of the cell's PFD to the remapped refuge value (black trace) gives a better prediction of behaviour than the PFD shift calculated using the initial refuge value (grey trace). Also, note that in the inter-trial interval following trial 3, the cell's PFD returns to this remapped refuge value (column 4 plot). Thus, the cell's PFD is reset to the new established reference. b, Remapping: in this example remapping occurs on trial 1 (column 1). In the following inter-trial interval (column 2), instead of returning to the initial refuge value (grey trace), the cell's PFD (see black trace) is closely aligned to the value recorded in the previous foraging trip (trial 1). As in the previous example, after remapping occurred, the cell's PFD resets to this new value in the refuge after subsequent foraging trials (column 4 shows inter-trial intervals 2 in black, 8 in blue, and 9 in green), and shows that the cell's PFD maintained this new refuge value for the remainder of the session. Note that for this example the initial refuge period is the same as the previous inter-trial interval since column 1 depicts the first trial. c, Resetting: the cell's PFD remains stable across all inter-trial refuge periods.
Figure 7
Figure 7
Moment-to-moment changes of the cell's PFD in two examples of resetting trials. For each example the foraging path is shown in the left panels (a, c), and the moment-to-moment HD of the animal coupled with cell activity (black bars) (Firing rate × HD × Time) is shown in the right panels (b, d). a & c, The animal's path has been divided into three parts: the outbound path is shown in black, the return path (from the pellet to the edge of the arena) is represented in red, and the correction path (from the apparatus edge to the refuge) is shown in blue. b & d, The red dots indicate the HD and time at which the cell's firing rate reached 50% of its maximum firing rate. Successive sampling episodes were isolated and the tuning curves for each episode (red trace) are compared with a reference (black trace). b, In panel 1 the cell's PFD at the beginning of the trial is compared to the only inter-trial value that could be recorded in that session (inter-trial value 2). In panels 2 to 4 the cell's PFD is compared to the PFD recorded at the beginning of the trial, and shows a slow drift counter-clockwise while the rat forages for the food pellet. Panel 5 shows the cell's PFD while the rat is correcting its orientation after reaching the wall of the arena (a, blue path) and presumably first perceives that it made an error. At that time, the PFD is reset to the value it had at the beginning of the trip (black). Notably, the cell does not fire when the rat is facing 170° (29th sec), which suggests that it was reset before reaching the refuge. This result would suggest that when the rats correct their homing direction (from apparatus edge to refuge), the cell's PFD is reset at the same time on their way to the refuge. d, Panels 1 to 3 show the cell's PFD drifting clockwise away from the preceding inter-trial value (black curve). Importantly, panel 4 shows that however the rat is correcting its error on its return to the refuge, the cell did not reset until the rat entered the refuge (panel 5). In this example, a second cell is visible with a PFD around 260° (green dots). Notably, these two cells are shifting in register: when the animal reaches the refuge, the first cell resets (red dots) and the PFD of the second cell (green dots) shifts approximately the same amount.
Figure 8
Figure 8
Moment-to-moment changes of the cell's PFD in an example of a remapping trial. a, Similar to Figure 7, the outbound path of the animal is shown in black, the return path in red, and the correction path in blue. b, Moment-to-moment HD of the animal coupled with the cell's activity (Firing rate × HD × Time). Similar to Figure 7, the tuning curves for the successively sampled episodes are represented below. Panels 1 and 2 show the cell's PFD drifting clockwise away from the value recorded in the preceding inter-trial value (black). The third panel depicts the cell's PFD after the animal reached the edge of the arena. Notably, in this trial and visible in a, the rat goes in the wrong direction (south-west door), while trying to find the refuge (located in south-east). The cell's PFD recorded at the same time (panel 3) reflects this error in the re-orientation process, by drifting farther away from its original value on the outbound foraging trip. Therefore, the re-orientation of the rat appears to be coupled with a predictable change in the cell's PFD. Panels 4 and 5 show a representative example of the remapping process, where the cell's PFD remains at the shifted value even after the rat returns to the refuge. In this case, however the rat manages to find the refuge, the cell's PFD is not reset when the animal reaches the refuge, but remains stable around 325°, which will be the new reference for subsequent trials.

References

    1. Darwin C. Origin of certain instincts. Nature. 1873;VII:417–418.
    1. Mittelstaedt H, Mittelstaedt M-L. In: Avian Navigation. Papi/Wallraff, editor. Springer-Verlag; Berlin: 1982.
    1. Etienne AS, Jeffery KJ. Path integration in mammals. Hippocampus. 2004;14:180–92. - PubMed
    1. O'Keefe J, Dostrovsky J. The hippocampus as a spatial map. Preliminary evidence from unit activity in the freely-moving rat. Brain Res. 1971;34:171–5. - PubMed
    1. Ranck JB., Jr. Neuroscience, S. f., editor. 1984.

Publication types