. 2012 Nov 15;120(20):4219-28.
doi: 10.1182/blood-2011-10-387050. Epub 2012 Sep 14.

Protein kinase D-HDAC5 signaling regulates erythropoiesis and contributes to erythropoietin cross-talk with GATA1

Affiliations

Protein kinase D-HDAC5 signaling regulates erythropoiesis and contributes to erythropoietin cross-talk with GATA1

Lorrie L Delehanty et al. Blood. .

Abstract

In red cell development, the differentiation program directed by the transcriptional regulator GATA1 requires signaling by the cytokine erythropoietin, but the mechanistic basis for this signaling requirement has remained unknown. Here we show that erythropoietin regulates GATA1 through protein kinase D activation, promoting histone deacetylase 5 (HDAC5) dissociation from GATA1, and subsequent GATA1 acetylation. Mice deficient for HDAC5 show resistance to anemic challenge and altered marrow responsiveness to erythropoietin injections. In ex vivo studies, HDAC5(-/-) progenitors display enhanced entry into and passage through the erythroid lineage, as well as evidence of erythropoietin-independent differentiation. These results reveal a molecular pathway that contributes to cytokine regulation of hematopoietic differentiation and offer a potential mechanism for fine tuning of lineage-restricted transcription factors by lineage-specific cytokines.


Figures

Figure 1
Figure 1
Implication of PKD in erythropoiesis. (A) G1ER proerythroblasts underwent differentiation induction with erythropoietin (Epo), estradiol, and kinase inhibitors; percentage hemoglobinized cells was assessed by benzidine staining. Data are mean ± SEM for 3 independent experiments. (B) G1ER cells transduced with shRNA constructs targeting PKD3 were assessed for PKD3 expression, class IIa HDAC phosphorylation, and erythroid differentiation. sh 186 provided strong knockdown of PKD3 expression; sh 187 provided no knockdown; and sh 188 provided weak knockdown. Left: Immunoblot (IB) of transduced cells (8% gel). Right: Differentiation induction with estradiol and erythropoietin (0.5, 0.1, or 0.05 U/mL), showing mean ± SEM for 3 experiments. *P < .05 for sh 186 vs controls at corresponding Epo doses. (C) Human primary progenitors cultured 5 days in erythroid medium with 100% or 15% transferrin saturation. Kinase inhibitors were included at 2μM in medium with 100% transferrin saturation. Flow cytometry for the erythroid marker glycophorin A (GPA) and the megakaryocyte marker CD41, with gating on viable fractions by forward (FSC) and side scatter (SSC). See also supplemental Figure 1. (D) Class IIa HDAC phosphorylation in human progenitors cultured 5 days in erythroid medium with 100% or 15% transferrin saturation (TSAT) or with kinase inhibitors (0.5, 1.0, and 2.0μM, all with 100% transferrin saturation). IB of whole cell lysates (12% gel).
Figure 2
Figure 2
Erythropoietin induction of PKD phosphorylation. (A) Erythropoietin–deprived G1ER cells were stimulated with erythropoietin, followed by immunoblotting for phospho- and total PKD. (B) Cytokine-starved human erythroid progenitors were stimulated with erythropoietin and analyzed as in panel A. (C) Impact of erythropoietin dosage and duration on steady-state PKD phosphorylation. Left: Human progenitors cultured 4 days with the indicated doses of erythropoietin. Right: Human progenitors cultured for the indicated durations with 4.5 U/mL erythropoietin. (D) Impact of iron availability on steady-state PKD phosphorylation. Human progenitors were cultured in erythroid medium under either iron replete (100% transferrin saturation) or iron restricted (15% transferrin saturation) conditions.
Figure 3
Figure 3
Functional implication of HDAC5 as a target of erythropoietin signaling. (A-B) HDAC inhibition partially substitutes for erythropoietin signaling during GATA1–induced erythroid differentiation. G1ER cells induced with estradiol ± erythropoietin (Epo) and ± SAHA were assessed for differentiation in panel A and viability in panel B. Data are mean ± SEM for 3 experiments. (C-E) G1ER cells transduced with shRNA constructs targeting HDAC5 were assessed for HDAC5 and HDAC4 expression, erythroid differentiation, and viability. (C) Immunoblot (IB) of whole cell lysates. sh 253 provided strong knockdown of HDAC5, and sh 252 provided no knockdown of HDAC5. (D) Differentiation of cells induced with estradiol and erythropoietin (0.5, 0.1, or 0.05 U/mL). *P = .01 for sh 253 vs control at corresponding Epo dose in 3 experiments. (E) Viability of cells induced with estradiol and erythropoietin. *P = .03. See also supplemental Figure 3 for HDAC4 knockdown data. (F-G) Distinct subcellular localization patterns of HDAC5 and HDAC4 in erythroid progenitors. (F) G1ER cells stimulated with erythropoietin (Epo) for the indicated durations were subjected to subcellular fractionation followed by immunoblotting for HDACs. Poly(ADP-ribose) polymerase and lactate dehydrogenase served as loading controls for nuclear and cytosolic fractions, respectively. (G) Human CD34+ progenitors grown in erythroid medium for the indicated durations were analyzed as in panel F.
Figure 4
Figure 4
Erythropoietin promotes dissociation of GATA1-HDAC5 complexes and acetylation of GATA1. (A) Analysis of GATA1 interaction with HDAC5 by GATA1 immunoprecipitation (IP). Extracts from G1ER cells ± erythropoietin (Epo) stimulation underwent IP with anti-GATA1 (G1) or control (Ctrl) antibodies followed by immunoblotting (IB) for HDAC5, HDAC4, and GATA1. “G1er” refers to the position of the GATA1-ER fusion. *Immunoglobulin heavy chain. See also supplemental Figure 4A. (B) Analysis of HDAC5 interaction with GATA1 by HDAC5 immunoprecipitation (IP). Extracts from G1ER cells expressing human HDAC5 ± Epo treatment underwent IP with anti–human-HDAC5 (H5) or control (Ctrl) antibodies followed by immunoblotting (IB) for GATA1 and HDAC5. “G1er” refers to the position of the GATA1-ER fusion. *Immunoglobulin heavy chain. (C-D) Analysis of GATA1 acetylation. (C) Extracts from G1ER cells ± erythropoietin stimulation underwent immunoprecipitation (IP) with anti–acetyl-lysine (AcK) or control (Ctrl) antibodies followed by immunoblotting. (D) Input levels of GATA1. (E-F) Contribution of PKD3 to erythropoietin–induced GATA1 acetylation. G1ER cells transduced with the sh 186 (PKD3 sh) and sh 187 (Control sh) constructs (see Figure 1B) were analyzed for GATA1 acetylation as in panels B and C. See also supplemental Figure 4.
Figure 5
Figure 5
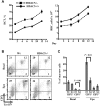
Increased marrow BFU-E frequency and enhanced responsiveness to anemic challenge in HDAC5−/− mice. (A) Colony-forming progenitor frequencies in marrows of adult WT and HDAC5−/− (KO) mice. Data are mean ± SEM (n = 3/group). (B) Marrow cellularity in adult WT and HDAC5−/− mice (n = 4/group). (C) RBC and Hb levels in animals before and after anemia induction. HDAC5+/+ and HDAC5−/− mice received PHZ on days −1 and 0. Data are mean ± SEM (n = 7/group). **P < .001. *P = .017. ##P < .0001. #P = 0.003. (D) Staining for iron deposition in HDAC5+/+ and HDAC5−/− spleens on day 13 after anemia induction. Shown are light microscope images (original magnification × 200) representative of findings in all animals studied (3/group). Images were acquired using an Olympus BX51 microscope equipped with an Olympus DP70 digital camera. The objective lens consisted of Uplan Fl 20×/0.75 NA. Image acquisition and processing were used: Adobe Photoshop, CS3/10.0 and CS2/9.0, respectively.
Figure 6
Figure 6
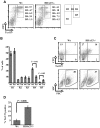
Altered marrow response to exogenous erythropoietin in HDAC5−/− mice. (A) Hematocrit (HCT) and RBC in adult WT and HDAC5−/− animals receiving weekly injections of the long-acting agent darbepoetin alfa. N = 6 animals/group. (B) Erythroid maturation in marrows of WT and HDAC5−/− mice after either no treatment (basal) or 3 injections of darbepoetin alfa (Epo). Flow cytometry for expression of CD71 and Ter119, with percentages shown within indicated quadrants. (C) Comparison of percentages of the less mature Ter119+ CD71+ progenitors and of the more mature Ter119+ CD71 progenitors. Composite of data from panel B analyzing marrows from WT or HDAC5−/− (KO) mice either untreated (basal) or darbepoetin-treated (mean ± SEM; n = 3/group).
Figure 7
Figure 7
Enhanced ex vivo maturation of HDAC5−/− progenitors in the presence and absence of erythropoietin. (A) HDAC5−/− progenitors yield increased proportions of Ter119+ CD71Intermediate cells (R5) in erythropoietin-containing cultures. Sorted Ter119 CD71Bright progenitors from WT and HDAC5−/− adult marrows were cultured 3 days in G1ER maintenance medium with 2 U/mL erythropoietin. Flow cytometric plots show proportions of cells at indicated stages (R2-R5) of erythroid maturation, with gating on viable cells. (B) Composite of 3 experiments performed as in panel A comparing WT and HDAC5−/− (KO) progenitors (mean ± SEM). (C) Erythropoietin–independent erythroid maturation of HDAC5−/− progenitors. Flow cytometric plots from an experiment conducted as in panel A, except using medium lacking erythropoietin (gating on viable cells). (D) Composite of 3 experiments conducted as in panel C, showing percentage Ter119+ cells (mean ± SEM).

Similar articles

Cited by

References

    1. Lodish H, Flygare J, Chou S. From stem cell to erythroblast: regulation of red cell production at multiple levels by multiple hormones. IUBMB Life. 2010;62(7):492–496. - PMC - PubMed
    1. Gregory T, Yu C, Ma A, Orkin SH, Blobel GA, Weiss MJ. GATA-1 and erythropoietin cooperate to promote erythroid cell survival by regulating bcl-xL expression. Blood. 1999;94(1):87–96. - PubMed
    1. Kadri Z, Maouche-Chretien L, Rooke HM, et al. Phosphatidylinositol 3-kinase/AKT induced by erythropoietin renders the erythroid differentiation factor GATA-1 competent for TIMP-1 gene transactivation. Mol Cell Biol. 2005;25(17):7412–7422. - PMC - PubMed
    1. Zhao W, Kitidis C, Fleming MD, Lodish HF, Ghaffari S. Erythropoietin stimulates phosphorylation and activation of GATA-1 via the PI3-kinase/AKT signaling pathway. Blood. 2006;107(3):907–915. - PMC - PubMed
    1. Ribeil J-A, Zermati Y, Vandekerckhove J, et al. Hsp70 regulates erythropoiesis by preventing caspase-3–mediated cleavage of GATA-1. Nature. 2007;445(1):102–105. - PubMed

Publication types

MeSH terms