

Upregulation of vascular endothelial growth factor receptor-3 in the spinal cord of Lewis rats with experimental autoimmune encephalomyelitis
- PMID: 22983493
- PMCID: PMC3534318
- DOI: 10.1369/0022155412462975
Upregulation of vascular endothelial growth factor receptor-3 in the spinal cord of Lewis rats with experimental autoimmune encephalomyelitis
Abstract
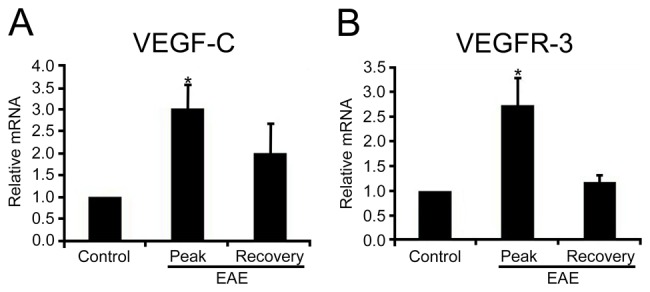
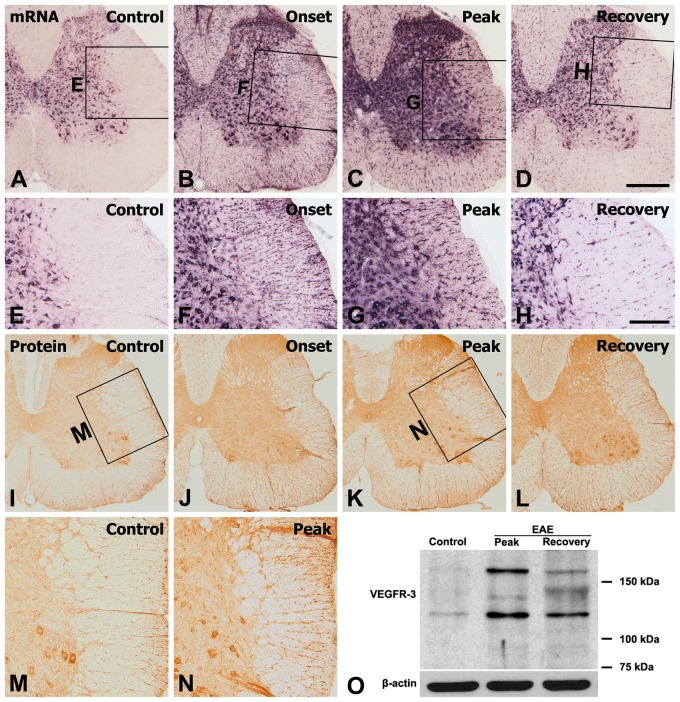
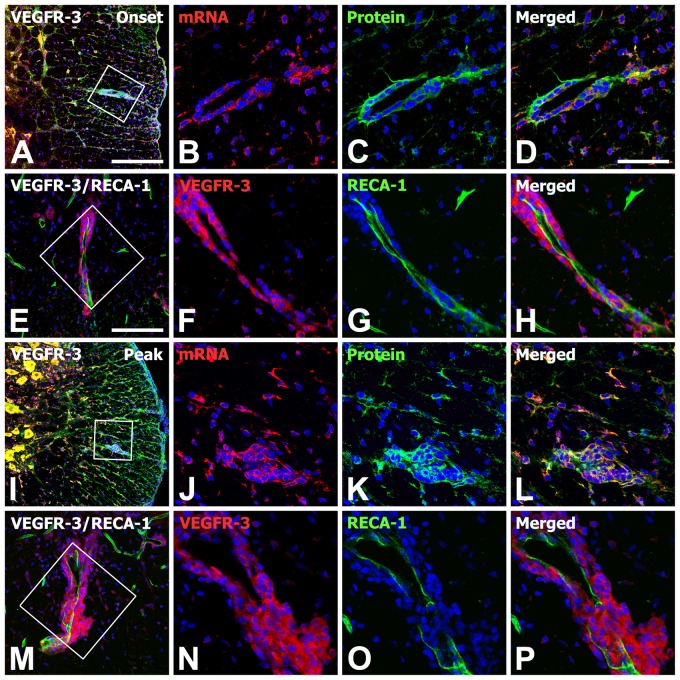
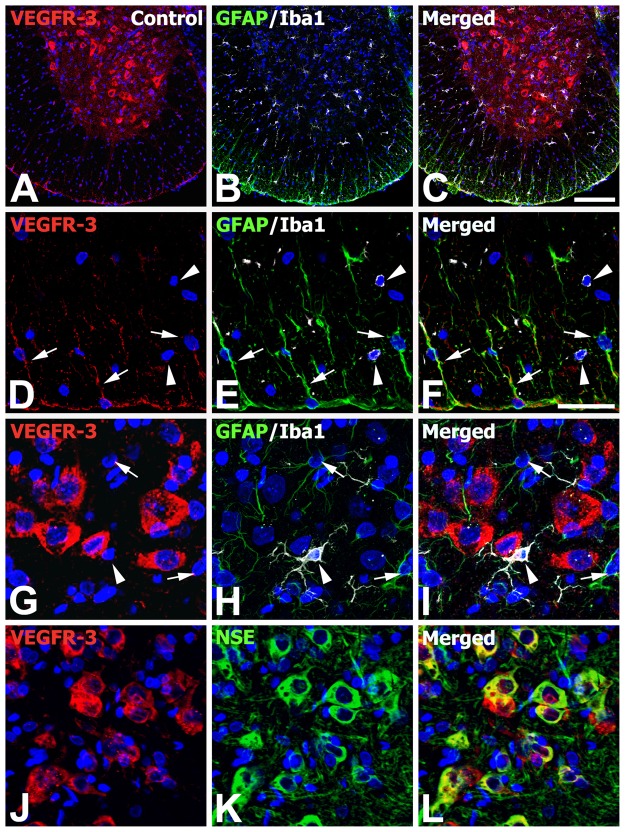
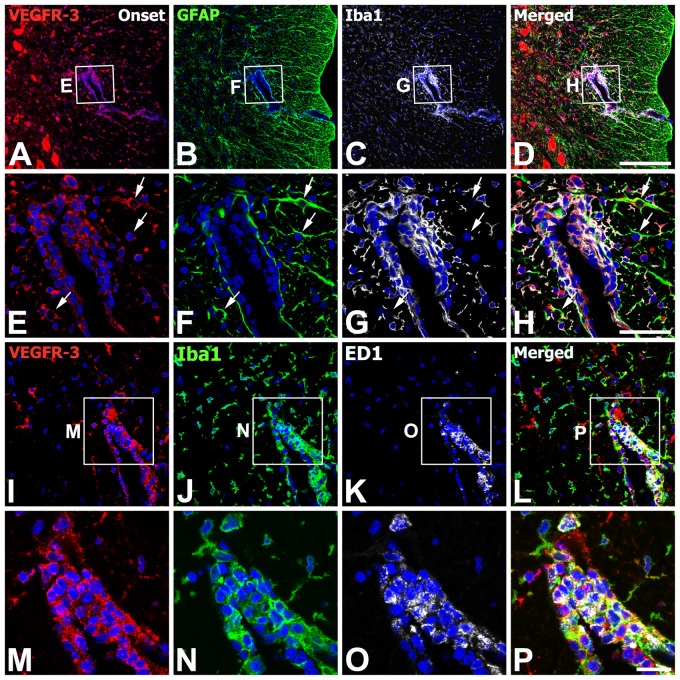
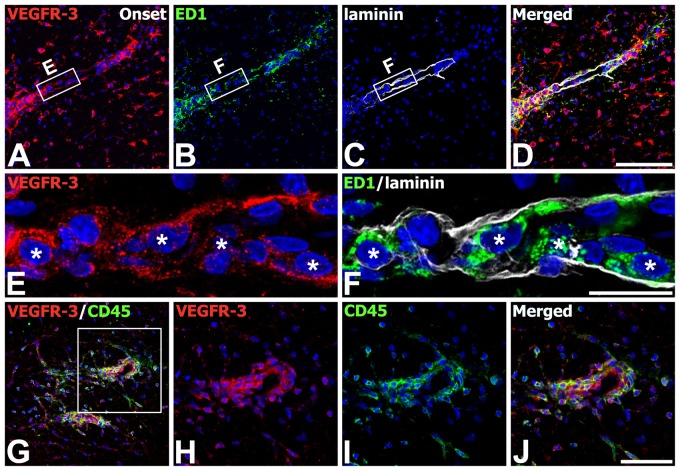
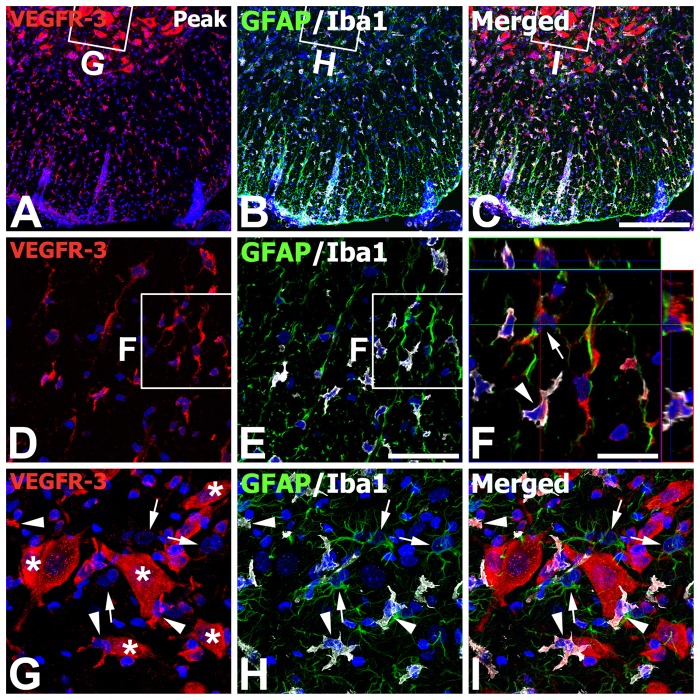
We investigated the spatiotemporal expression of vascular endothelial growth factor receptor-3 (VEGFR-3) in the spinal cord of Lewis rats with experimental autoimmune encephalomyelitis (EAE), an animal model for multiple sclerosis. VEGFR-3 mRNA and protein were constitutively expressed in gray matter neurons and in a few white matter astrocytes. Induction of VEGFR-3 occurred predominantly in perivascular infiltrated macrophages in the spinal cord white matter during the inductive phase of EAE. VEGFR-3 expression was also induced in activated microglial cells in the gray and white matter, mainly in the peak phase. In addition, reactive astrocytes in the white matter, but not in the gray matter, expressed VEGFR-3 as disease severity increased. These data suggest that VEGFR-3 is involved in the recruitment of monocytic macrophages and in glial reactions during EAE.
Conflict of interest statement
Figures
Similar articles
-
Sequential expression of transforming growth factor-beta1 by T-cells, macrophages, and microglia in rat spinal cord during autoimmune inflammation.J Neuropathol Exp Neurol. 1998 May;57(5):385-95. doi: 10.1097/00005072-199805000-00002. J Neuropathol Exp Neurol. 1998. PMID: 9596409
-
The upregulation of nerve growth factor receptors in reactive astrocytes of rat spinal cord during experimental autoimmune encephalomyelitis.Neurosci Lett. 2001 Aug 10;308(3):165-8. doi: 10.1016/s0304-3940(01)02001-8. Neurosci Lett. 2001. PMID: 11479014
-
Differential expression of fibroblast growth factor-2 and receptor by glial cells in experimental autoimmune encephalomyelitis (EAE).Glia. 1996 Feb;16(2):93-100. doi: 10.1002/(SICI)1098-1136(199602)16:2<93::AID-GLIA1>3.0.CO;2-B. Glia. 1996. Retraction in: Glia. 1997 May;20(1):86. PMID: 8929896 Retracted.
-
Increased expression of colony-stimulating factor-1 in mouse spinal cord with experimental autoimmune encephalomyelitis correlates with microglial activation and neuronal loss.Glia. 2018 Oct;66(10):2108-2125. doi: 10.1002/glia.23464. Epub 2018 Aug 25. Glia. 2018. PMID: 30144320
-
Expression of osteopontin and its ligand, CD44, in the spinal cords of Lewis rats with experimental autoimmune encephalomyelitis.J Neuroimmunol. 2004 Jun;151(1-2):78-84. doi: 10.1016/j.jneuroim.2004.02.014. J Neuroimmunol. 2004. PMID: 15145606
Cited by
-
SIX1 aggravates the progression of spinal cord injury in mice by promoting M1 polarization of microglia.Sci Rep. 2025 Jan 8;15(1):1283. doi: 10.1038/s41598-024-82121-3. Sci Rep. 2025. PMID: 39779741 Free PMC article.
-
Piezo1 regulates meningeal lymphatic vessel drainage and alleviates excessive CSF accumulation.Nat Neurosci. 2024 May;27(5):913-926. doi: 10.1038/s41593-024-01604-8. Epub 2024 Mar 25. Nat Neurosci. 2024. PMID: 38528202 Free PMC article.
-
Meningeal Lymphatics in Central Nervous System Diseases.Annu Rev Neurosci. 2024 Aug;47(1):323-344. doi: 10.1146/annurev-neuro-113023-103045. Epub 2024 Jul 1. Annu Rev Neurosci. 2024. PMID: 38648267 Free PMC article. Review.
-
CNS-Draining Meningeal Lymphatic Vasculature: Roles, Conundrums and Future Challenges.Front Pharmacol. 2021 Apr 28;12:655052. doi: 10.3389/fphar.2021.655052. eCollection 2021. Front Pharmacol. 2021. PMID: 33995074 Free PMC article. Review.
-
Expression of vascular endothelial growth factor-C (VEGF-C) and its receptor (VEGFR-3) in the glial reaction elicited by human mesenchymal stem cell engraftment in the normal rat brain.J Histochem Cytochem. 2015 Mar;63(3):170-80. doi: 10.1369/0022155414564218. Epub 2014 Dec 3. J Histochem Cytochem. 2015. PMID: 25473093 Free PMC article.
References
-
- Ajami B, Bennett JL, Krieger C, McNagny KM, Rossi FM. 2011. Infiltrating monocytes trigger EAE progression, but do not contribute to the resident microglia pool. Nat Neurosci. 14:1142–1149 - PubMed
-
- Almolda B, Costa M, Montoya M, González B, Castellano BJ. 2009. CD4 microglial expression correlates with spontaneous clinical improvement in the acute Lewis rat EAE model. J Neuroimmunol. 209:65–80 - PubMed
-
- Almolda B, Gonzalez B, Castellano B. 2011. Antigen presentation in EAE: role of microglia, macrophages and dendritic cells. Front Biosci. 16:1157–1171 - PubMed
-
- Aquino DA, Chiu FC, Brosnan CF, Norton WT. 1988. Glial fibrillary acidic protein increases in the spinal cord of Lewis rats with acute experimental autoimmune encephalomyelitis. J Neurochem. 51:1085–1096 - PubMed
-
- Bauer J, Huitinga I, Zhao W, Lassmann H, Hickey WF, Dijkstra CD. 1995. The role of macrophages, perivascular cells, and microglial cells in the pathogenesis of experimental autoimmune encephalomyelitis. Glia. 15:437–446 - PubMed
Publication types
MeSH terms
Substances
LinkOut - more resources
Full Text Sources
Miscellaneous
