Comparative Study
. 2013 Mar;471(3):843-50.
doi: 10.1007/s11999-012-2577-z.

Treating metastatic disease: Which survival model is best suited for the clinic?

Affiliations
Comparative Study

Treating metastatic disease: Which survival model is best suited for the clinic?

Jonathan Agner Forsberg et al. Clin Orthop Relat Res. 2013 Mar.

Abstract

Background: To avoid complications associated with under- or overtreatment of patients with skeletal metastases, doctors need accurate survival estimates. Unfortunately, prognostic models for patients with skeletal metastases of the extremities are lacking, and physician-based estimates are generally inaccurate.

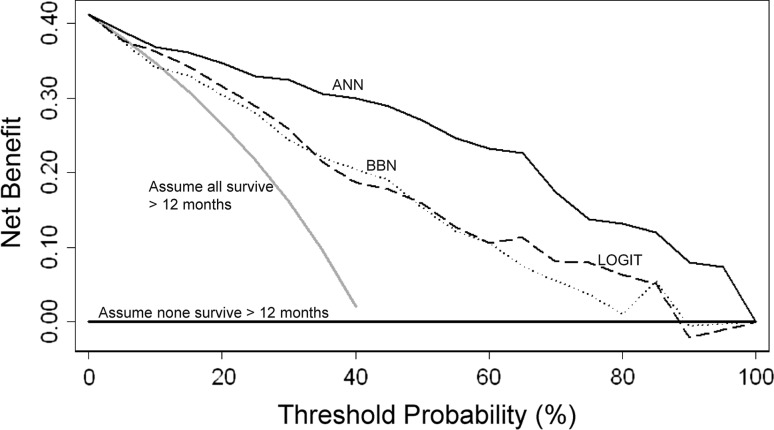
Questions/purposes: We developed three types of prognostic models and compared them using calibration plots, receiver operating characteristic (ROC) curves, and decision curve analysis to determine which one is best suited for clinical use.

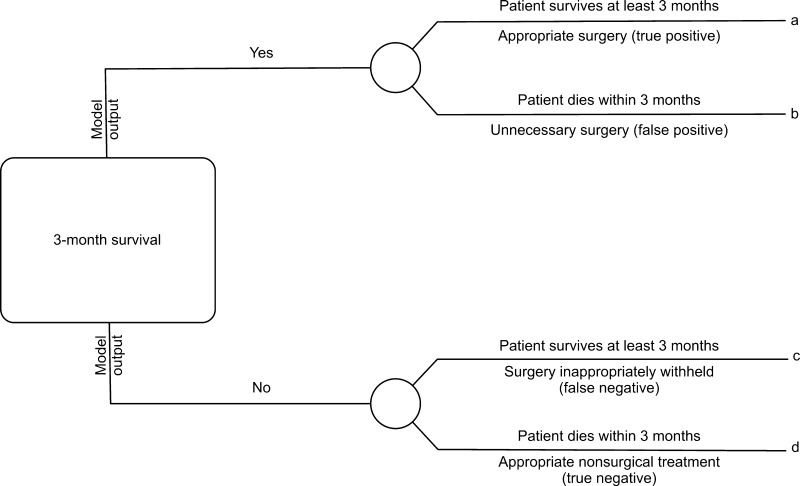
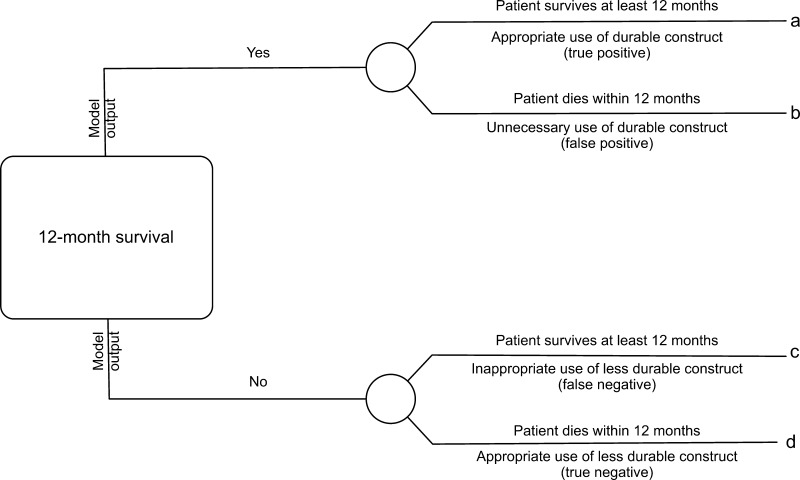
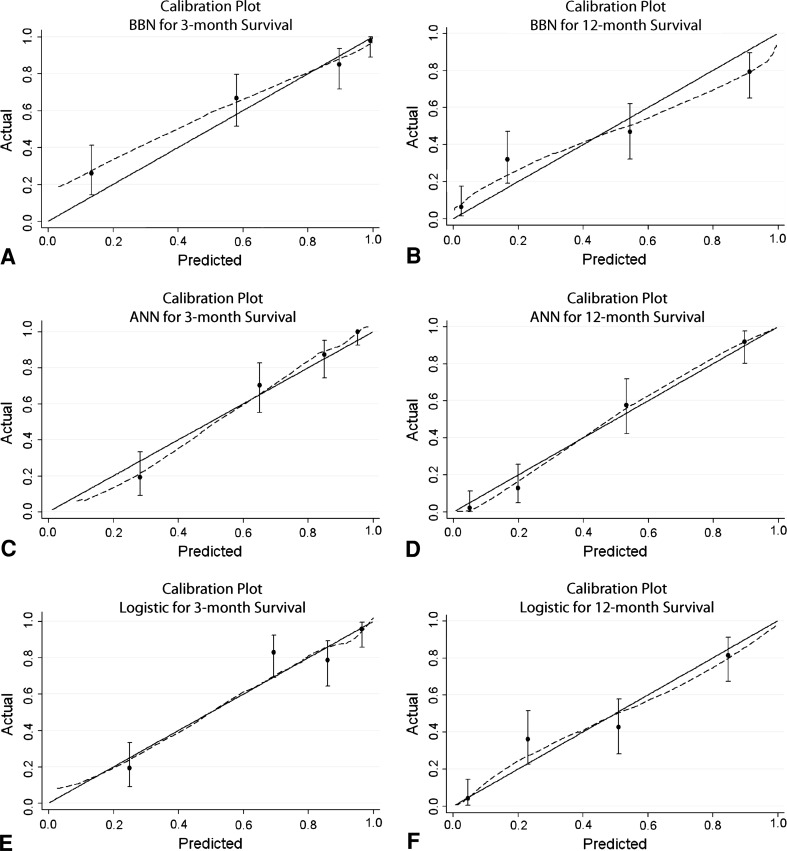
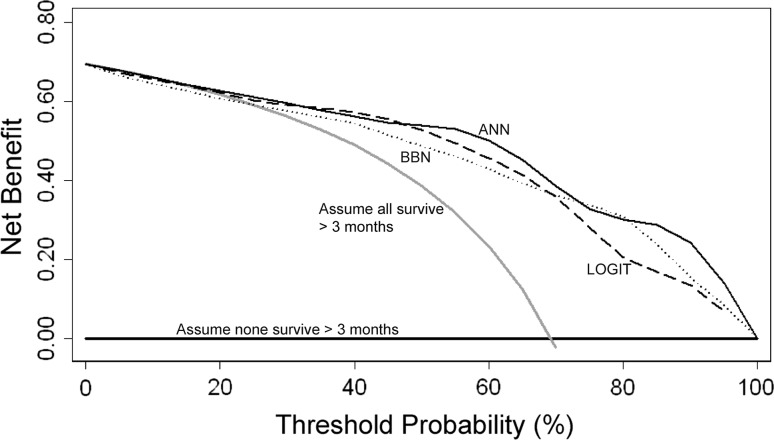
Methods: A training set consisted of 189 patients who underwent surgery for skeletal metastases. We created models designed to predict 3- and 12-month survival using three methods: an Artificial Neural Network (ANN), a Bayesian Belief Network (BBN), and logistic regression. We then performed crossvalidation and compared the models in three ways: calibration plots plotting predicted against actual risk; area under the ROC curve (AUC) to discriminate the probability that a patient who died has a higher predicted probability of death compared to a patient who did not die; and decision curve analysis to quantify the clinical consequences of over- or undertreatment.

Results: All models appeared to be well calibrated, with the exception of the BBN, which underestimated 3-month survival at lower probability estimates. The ANN models had the highest discrimination, with an AUC of 0.89 and 0.93, respectively, for the 3- and 12-month models. Decision analysis revealed all models could be used clinically, but the ANN models consistently resulted in the highest net benefit, outperforming the BBN and logistic regression models.

Conclusions: Our observations suggest use of the ANN model to aid decisions about surgery would lead to better patient outcomes than other alternative approaches to decision making.

Level of evidence: Level II, prognostic study. See Instructions for Authors for a complete description of levels of evidence.


Figures

Fig. 1
Fig. 1
This decision tree represents the four possible scenarios stemming from the use of the 3-month models. Each outcome, a, b, c, or d, corresponds to a theoretical clinical scenario. For instance, true positives are those in which appropriate surgical treatment is rendered, false positives are those in which unnecessary surgery is performed, false negatives are those in which surgery was inappropriately withheld, and true negatives are those in which appropriate nonsurgical or less invasive treatment is rendered.
Fig. 2
Fig. 2
This decision tree represents the four possible scenarios stemming from the use of the 12-month models. Each outcome, a, b, c, or d, corresponds to a theoretical clinical scenario. For instance, true positives are those that result in the appropriate use of durable implants, false positives are those in which more durable implant are used unnecessarily (when less durable implants would have sufficed), false negatives are those in which less durable implants were used when more durable implants were required, and true negatives are those in which appropriate less durable implants were used.
Fig. 3A−F
Fig. 3A−F
Calibration plots are shown for the (A) 3- and (B) 12-month BBN models, (C) 3- and (D) 12-month ANN models, and (E) 3- and (F) 12-month logistic regression models. Calibration plots illustrate the agreement between observed outcomes and predictions. Perfect calibration to the training data should overlie the 45° solid line. Note the 3-month BBN model appears miscalibrated at low probability estimates by underestimating actual survival.
Fig. 4
Fig. 4
Comparing the 3-month models using decision curve analysis, net benefit is plotted versus threshold probability of 3-month survival. All models (ANN, BBN, logistic regression [LOGIT]) performed similarly and could be used clinically rather than assume all patients (or no patients) will survive longer than 3 months after surgery.
Fig. 5
Fig. 5
Comparing the 12-month models using decision curve analysis, net benefit is plotted versus threshold probability of 12-month survival. All models (ANN, BBN, logistic regression [LOGIT]) resulted in positive net benefit, indicating they could be used clinically rather than assume all patients (or no patients) will survive longer than 12 months after surgery. Note the ANN outperformed the other models across all threshold probabilities, including the clinically useful threshold probability of 50% estimated survival at 12 months.

References

    1. Bauer HC, Wedin R. Survival after surgery for spinal and extremity metastases: prognostication in 241 patients. Acta Orthop Scand. 1995;66:143–146. doi: 10.3109/17453679508995508. - DOI - PubMed
    1. Cook NR. Use and misuse of the receiver operating characteristic curve in risk prediction. Circulation. 2007;115:928–935. doi: 10.1161/CIRCULATIONAHA.106.672402. - DOI - PubMed
    1. Forsberg JA, Eberhardt J, Boland PJ, Wedin R, Healey JH. Estimating survival in patients with operable skeletal metastases: an application of a bayesian belief network. PLoS ONE. 2011;6:e19956. doi: 10.1371/journal.pone.0019956. - DOI - PMC - PubMed
    1. Glare P. Clinical predictors of survival in advanced cancer. J Support Oncol. 2005;3:331–339. - PubMed
    1. Glare P, Virik K, Jones M, Hudson M, Eychmuller S, Simes J, Christakis N. A systematic review of physicians’ survival predictions in terminally ill cancer patients. BMJ. 2003;327:195–198. doi: 10.1136/bmj.327.7408.195. - DOI - PMC - PubMed

Publication types

MeSH terms