

Polymer scaling laws of unfolded and intrinsically disordered proteins quantified with single-molecule spectroscopy
- PMID: 22984159
- PMCID: PMC3479594
- DOI: 10.1073/pnas.1207719109
Polymer scaling laws of unfolded and intrinsically disordered proteins quantified with single-molecule spectroscopy
Abstract
The dimensions of unfolded and intrinsically disordered proteins are highly dependent on their amino acid composition and solution conditions, especially salt and denaturant concentration. However, the quantitative implications of this behavior have remained unclear, largely because the effective theta-state, the central reference point for the underlying polymer collapse transition, has eluded experimental determination. Here, we used single-molecule fluorescence spectroscopy and two-focus correlation spectroscopy to determine the theta points for six different proteins. While the scaling exponents of all proteins converge to 0.62 ± 0.03 at high denaturant concentrations, as expected for a polymer in good solvent, the scaling regime in water strongly depends on sequence composition. The resulting average scaling exponent of 0.46 ± 0.05 for the four foldable protein sequences in our study suggests that the aqueous cellular milieu is close to effective theta conditions for unfolded proteins. In contrast, two intrinsically disordered proteins do not reach the Θ-point under any of our solvent conditions, which may reflect the optimization of their expanded state for the interactions with cellular partners. Sequence analyses based on our results imply that foldable sequences with more compact unfolded states are a more recent result of protein evolution.
Conflict of interest statement
The authors declare no conflict of interest.
Figures
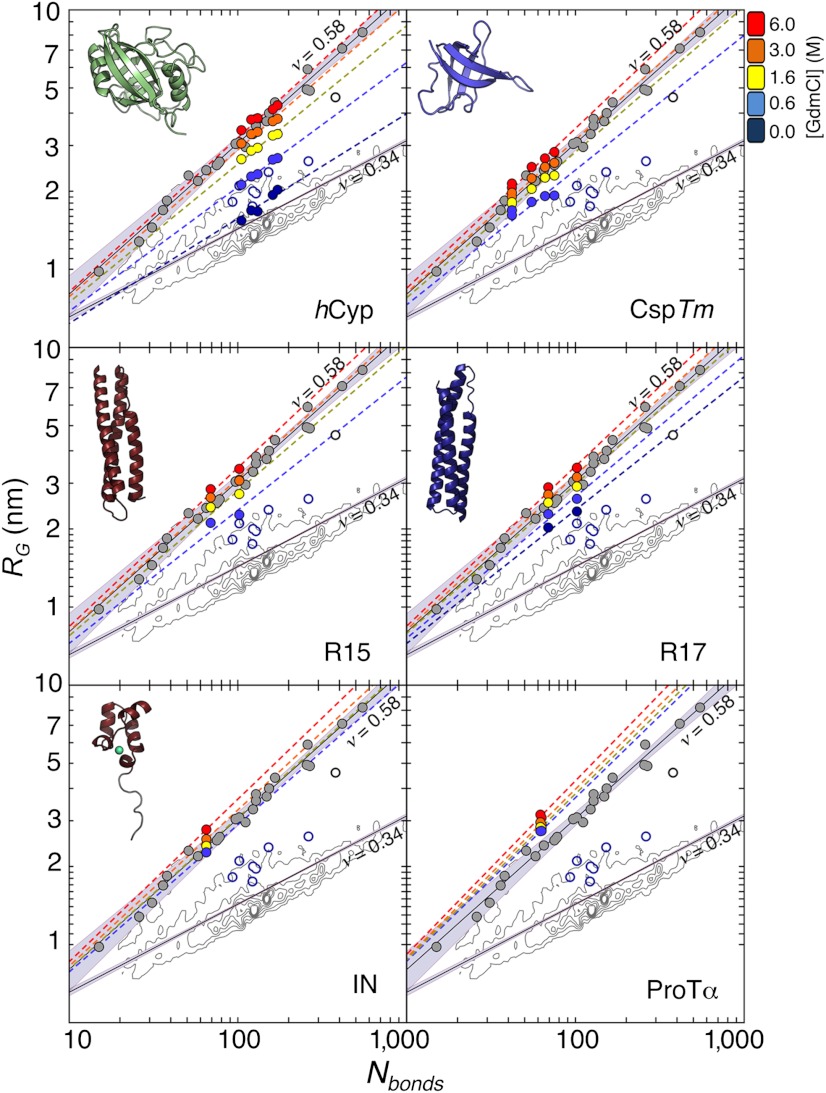
 . The contour plots represent the distribution of RG values for the folded proteins shown in A. Gray circles are the RG values determined for unfolded proteins via SAXS, taken from Kohn et al. (40). Open blue circles are RG values of denatured proteins under native conditions determined with SAXS, taken from Uzawa et al. (30). Black solid lines are fits of the data taken from Kohn et al. (40) and of the 10,905 monomeric native proteins from the Protein Data Bank with Eq. 3. The resulting scaling exponents are indicated.
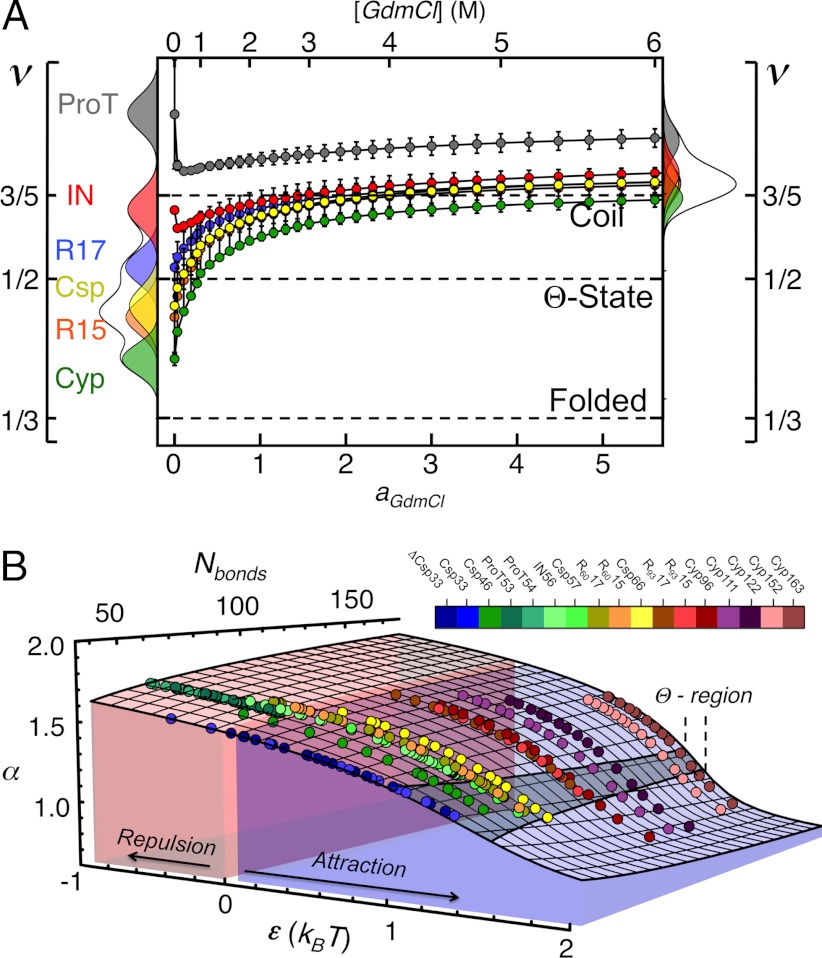
 by ± 10% around its estimated value of 0.40 nm. (B) Comparison between experimentally determined expansion factors α (filled circles) for all variants and proteins of this study and the numerically computed expansion factors α with our estimate for RGΘ using Eq. 1. Shaded volumes indicate the regimes of attractive (ε > 0) and repulsive (ε < 0) intrachain interaction energies. The gray shaded region indicates the transition regime between αc = 1, the critical value for infinitely long chains, and αc = 1 + (19/22)ϕ0, the approximation for finite chains as given by Sanchez (21). Here, ϕ0 is the volume fraction of the Θ-state relative to the most compact state (
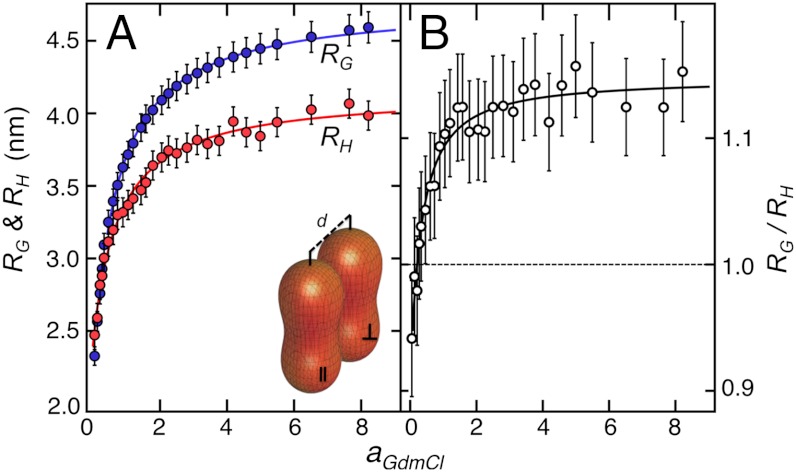
 by ± 10%. Error bars for RH represent the standard deviation of ± 0.1 nm estimated from the calibration of the instrument (
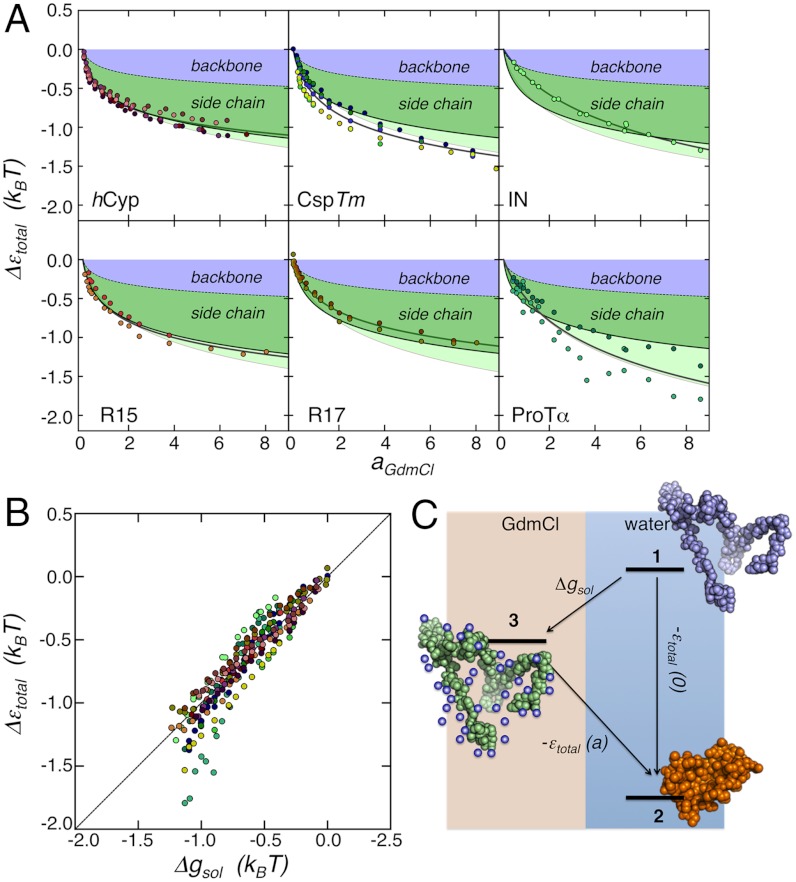
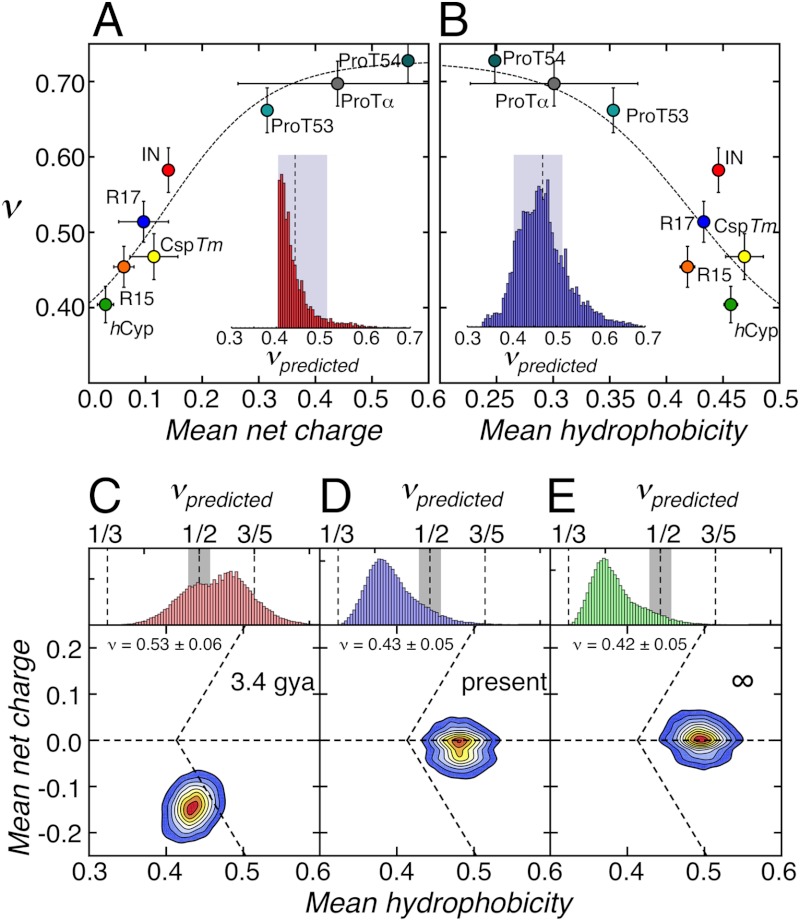
 by ± 10%. Dashed lines in A and B are global fits according to empirical equations chosen to give reasonable limits of ν (
References
-
- Schuler B, Lipman E, Eaton W. Probing the free-energy surface for protein folding with single-molecule fluorescence spectroscopy. Nature. 2002;419:743–747. - PubMed
Publication types
MeSH terms
Substances
LinkOut - more resources
Full Text Sources
Other Literature Sources
