. 2012 Nov 9;287(46):38665-79.
doi: 10.1074/jbc.M112.367490. Epub 2012 Sep 14.

14-3-3ε and 14-3-3σ inhibit Toll-like receptor (TLR)-mediated proinflammatory cytokine induction

Affiliations

14-3-3ε and 14-3-3σ inhibit Toll-like receptor (TLR)-mediated proinflammatory cytokine induction

Aisha Qasim Butt et al. J Biol Chem. .

Retraction in

Abstract

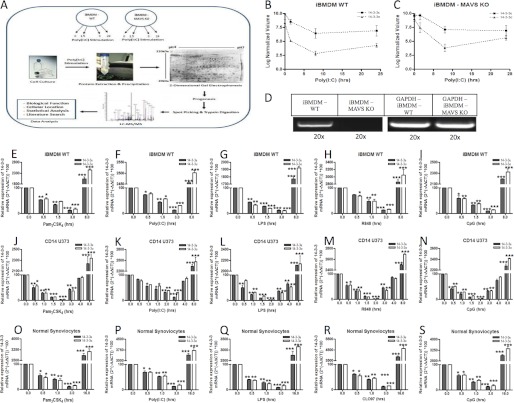
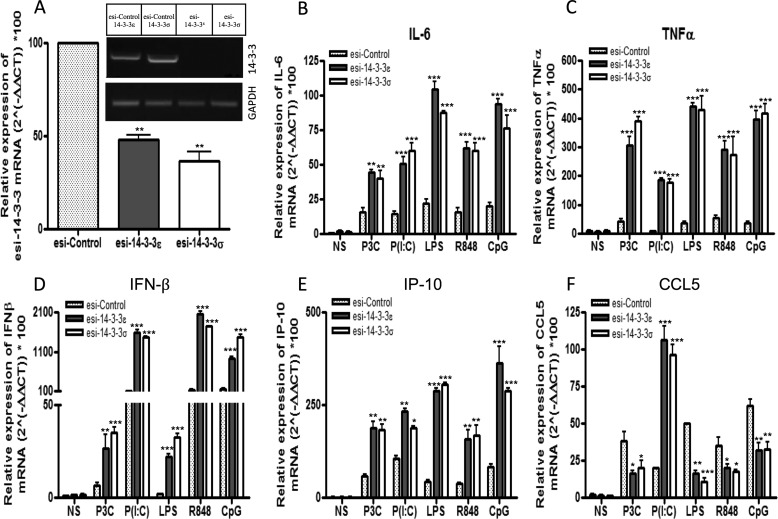
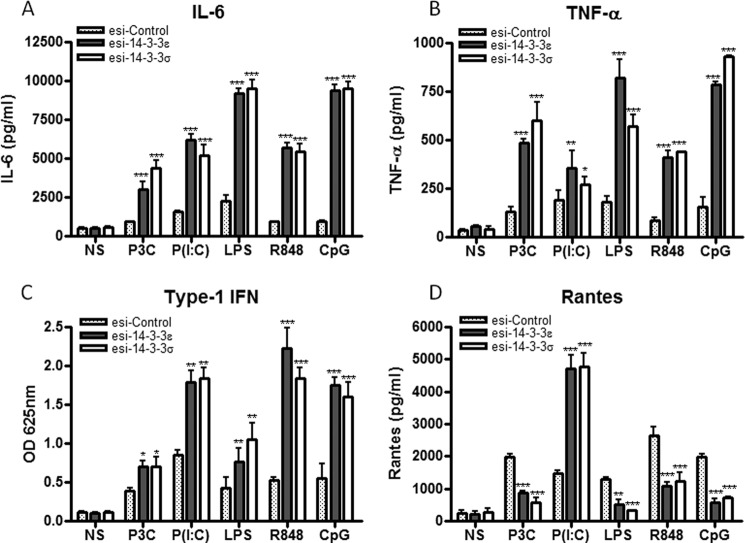
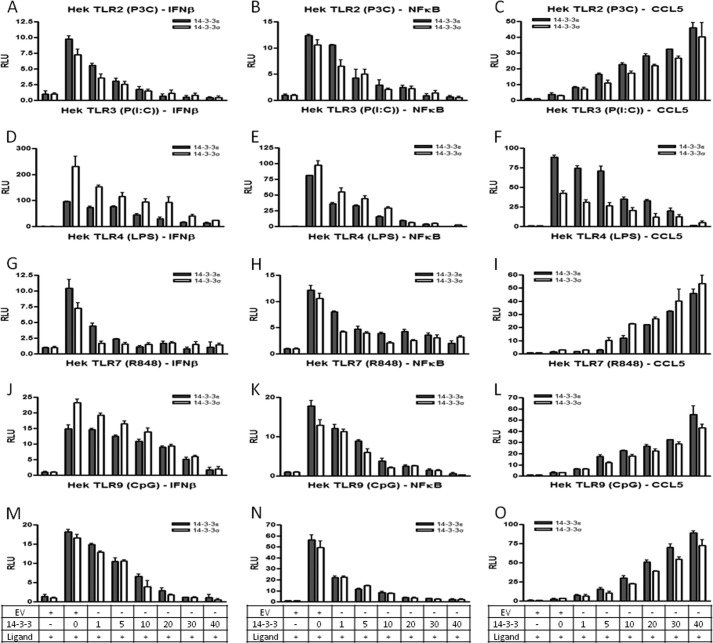
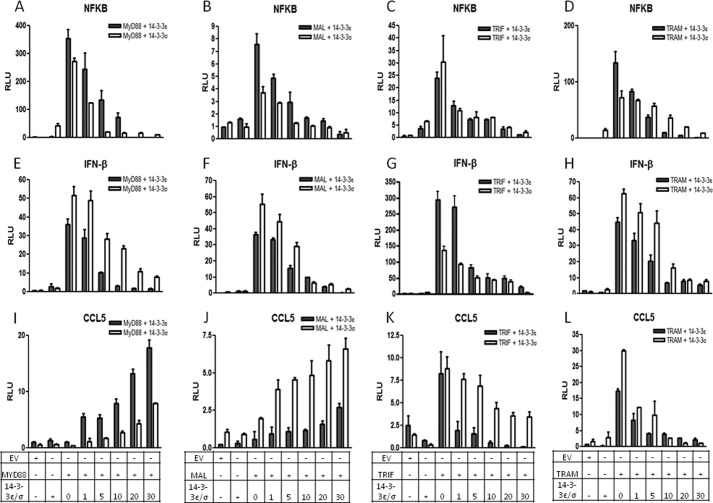
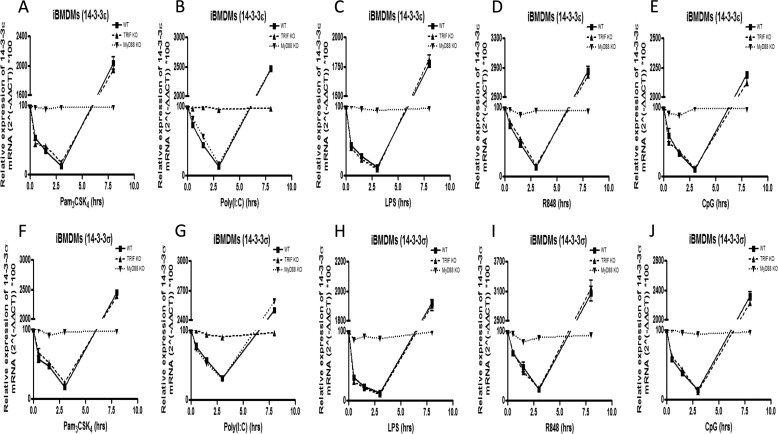
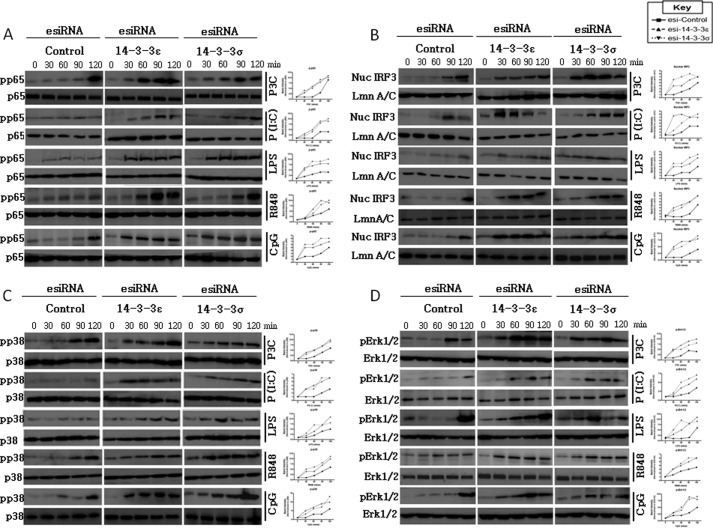
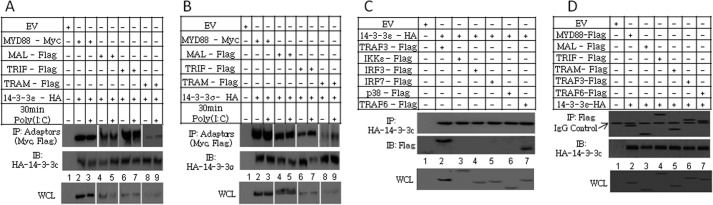
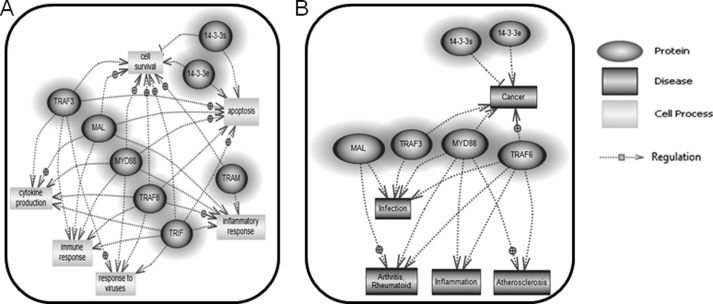
Toll-like receptors (TLRs) are a group of pattern recognition receptors that play a crucial role in the induction of the innate immune response against bacterial and viral infections. TLR3 has emerged as a key sensor of viral double-stranded RNA. Thus, a clearer understanding of the biological processes that modulate TLR3 signaling is essential. Limited studies have applied proteomics toward understanding the dynamics of TLR signaling. Herein, a proteomics approach identified 14-3-3ε and 14-3-3σ proteins as new members of the TLR signaling complex. Toward the functional characterization of 14-3-3ε and 14-3-3σ in TLR signaling, we have shown that both of these proteins impair TLR2, TLR3, TLR4, TLR7/8, and TLR9 ligand-induced IL-6, TNFα, and IFN-β production. We also show that 14-3-3ε and 14-3-3σ impair TLR2-, TLR3-, TLR4-, TLR7/8-, and TLR9-mediated NF-κB and IFN-β reporter gene activity. Interestingly, although the 14-3-3 proteins inhibit poly(I:C)-mediated RANTES production, 14-3-3 proteins augment Pam(3)CSK(4), LPS, R848, and CpG-mediated production of RANTES (regulated on activation normal T cell expressed and secreted) in a Mal (MyD88 adaptor-like)/MyD88-dependent manner. 14-3-3ε and 14-3-3σ also bind to the TLR adaptors and to both TRAF3 and TRAF6. Our study conclusively shows that 14-3-3ε and 14-3-3σ play a major regulatory role in balancing the host inflammatory response to viral and bacterial infections through modulation of the TLR signaling pathway. Thus, manipulation of 14-3-3 proteins may represent novel therapeutic targets for inflammatory conditions and infections.


Figures

FIGURE 1.
FIGURE 1.
14-3-3 proteins are novel components of TLR signaling pathway. A, experimental workflow. Wild-type and MAVS−/− iBMDMs were stimulated with poly(I:C) (20 μg/ml) for a range of times (0, 1.5, 8, and 24 h). The proteins from the cells were extracted using acetone precipitation, and samples were subjected to two-dimensional gel electrophoresis as described under “Experimental Procedures.” Gel cross-comparison was performed using Progenesis software, and differentially expressed protein spots were picked, digested with trypsin, and identified using nano-LC-MS/MS as described under “Experimental Procedures.” The data analysis was performed using the MASCOT database, and biological and cellular characteristics of the proteins were recorded. B and C, average -fold change of the differentially expressed protein spots shown as log normalized volumes comparing the protein spot volume in gels stimulated for 1.5, 8, and 24 h with poly(I:C) as compared with the control gels (0 h). D, RT-PCR was performed to verify the absence of MAVS adaptor in MAVS−/− iBMDMs using forward and reverse primers. The samples were diluted 20× and were subjected to DNA gel electrophoresis. GAPDH was used to normalize all samples, and -fold changes were determined relative to control. Wild-type iBMDMs (E–I), U373-CD14 (J–N), and synoviocyte cells (O–S) were stimulated with Pam3CSK4 (1 μg/ml), poly(I:C) (20 μg/ml), LPS (1 μg/ml), R848 (1 μg/ml), and CpG (5 μg/ml) for a range of times (0, 0.5, 1.5, 3, 4, and 8 h), and total RNA was isolated, converted to first strand DNA, and used as a template for quantitative real-time RT-PCR as described under “Experimental Procedures” to assay the expression levels of 14-3-3ϵ and 14-3-3σ. The data presented are representative of at least three independent experiments performed in triplicate (mean ± S.E. (error bars)). Statistical analysis was performed using unpaired Student's t test and two-way ANOVA tests comparing the test samples with their respective controls.
FIGURE 2.
FIGURE 2.
Suppression of 14-3-3ϵ and 14-3-3σ affects TLR2-, TLR3-, TLR4-, TLR7/8-, and TLR9-mediated IL-6, TNF-α, IFNβ, IP-10, and CCL5 expression. A–F, U373-CD14 cells were pretreated with either control lamin A/C or 14-3-3ϵ and 14-3-3σ esiRNA to target their suppression. After 24 h, cells were stimulated with Pam3CSK4 (1 μg/ml; P3C), poly(I:C) (20 μg/ml; P(I:C)), LPS (1 μg/ml), R848 (1 μg/ml), and CpG (5 μg/ml) for 3 h, and total RNA was isolated, converted to first strand DNA, and used as a template for quantitative real-time RT-PCR as described under “Experimental Procedures” to assay the expression levels of IL-6 (B), TNF-α (C), IFN-β (D), IP-10 (E), and CCL5 (F) or basal 14-3-3ϵ and 14-3-3σ in unstimulated cells (A). GAPDH was used to normalize all samples, and -fold changes were determined relative to unstimulated control. The data presented are representative of at least three independent experiments performed in triplicate (mean ± S.E. (error bars)). Statistical analysis was performed using unpaired Student's t test and two-way ANOVA tests comparing the test samples with their respective controls. NS, non-stimulated.
FIGURE 3.
FIGURE 3.
Suppression of 14-3-3ϵ and 14-3-3σ augments TLR2-, TLR3-, TLR4-, TLR7/8-, and TLR9-induced proinflammatory cytokine release. A–D, U373-CD14 cells were pretreated with either control lamin or 14-3-3ϵ and 14-3-3σ esiRNA to target their suppression. After 24 h, cells were stimulated with Pam3CSK4 (1 μg/ml; P3C), poly(I:C) (20 μg/ml; P(I:C)), LPS (1 μg/ml), R848 (1 μg/ml), and CpG (5 μg/ml) for 24 h as indicated. Thereafter, IL-6 (A), TNFα (B), type I IFN (C), and RANTES (D) were measured by ELISA as described under “Experimental Procedures.” The data presented are representative of at least three independent experiments performed in triplicate (mean ± S.E. (error bars)). Statistical analysis was performed using unpaired Student's t test and two-way ANOVA tests comparing the test samples with their respective controls. NS, non-stimulated.
FIGURE 4.
FIGURE 4.
14-3-3ϵ and 14-3-3σ inhibit TLR2-, TLR3-, TLR4-, TLR7/8-, and TLR9-mediated NF-κB and IFN-β reporter gene activity but enhance TLR2-, TLR4-, TLR7/8-, and TLR9-mediated CCL5 reporter gene activity. HEK293-TLR2 (A–C), HEK293-TLR3 (D–F), HEK293-TLR4 (G–I), HEK293-TLR7 (J–L), and HEK293-TLR9 cells (M–O) were co-transfected with vectors encoding a reporter gene for the IFN-β, NF-κB, or CCL5 promoter (80 ng) and either empty vector (40 ng) or increasing amounts of an expression vector encoding 14-3-3ϵ or 14-3-3σ (0, 1, 5, 10, 20, 30, or 40 ng), as indicated. A total of 40 ng/well phRL-TK (TK-Renilla-luciferase) reporter gene was co-transfected simultaneously to normalize data for transfection efficiency After 24 h, cells were stimulated with Pam3CSK4 (1 μg/ml; P3C) (A–C), poly(I:C) (20 μg/ml; P(I:C)) (D–F), LPS (1 μg/ml) (G–I), R848 (1 μg/ml) (J–L), and CpG (5 μg/ml) (M–O) for 24 h followed by harvesting of cell lysates and assessment of luciferase reporter gene activity. The data presented are representative of at least three independent experiments performed in triplicate (mean ± S.E. (error bars)). Statistical analysis was performed using unpaired Student's t test and two-way ANOVA tests comparing the test samples with their respective controls.
FIGURE 5.
FIGURE 5.
14-3-3ϵ and 14-3-3σ inhibit TLR adaptor-dependent NF-κB and IFN-β reporter gene activity but differentially affect CCL5 reporter gene activity. A–L, HEK293 cells were co-transfected with vectors encoding a reporter gene for either the IFN-β, NF-κB, or CCL5 promoter (80 ng) and either empty vector (40 ng), MyD88, MAL, TRIF, or TRAM plasmids (10 ng) and increasing amounts of an expression vector encoding 14-3-3ϵ or 14-3-3σ (0, 1, 5, 10, 20, or 30 ng), as indicated. A total of 40 ng/well phRL-TK (TK-Renilla-luciferase) reporter gene was co-transfected simultaneously to normalize data for transfection efficiency After 24 h, cell lysates were harvested and assessed for luciferase reporter gene activity. The data presented are representative of at least three independent experiments performed in triplicate (mean ± S.E. (error bars)). Statistical analysis was performed using unpaired Student's t test and two-way ANOVA tests comparing the test samples with their respective controls.
FIGURE 6.
FIGURE 6.
Pam3CSK4-, LPS-, R848-, and CpG-mediated 14-3-3 expression is MyD88-dependent, whereas poly(I:C)-mediated 14-3-3 expression is TRIF-dependent. A–J, WT, TRIF−/−, and MyD88−/− iBMDMs were stimulated with Pam3CSK4 (1 μg/ml) (A and F), poly(I:C) (20 μg/ml) (B and G), LPS (1 μg/ml) (C and H), R848 (1 μg/ml) (D and I), and CpG (5 μg/ml) (E and J) for the indicated times (0, 0.5, 1.5, 3, and 8 h). Then total RNA was isolated, converted to first strand DNA, and used as a template for quantitative real-time RT-PCR as described under “Experimental Procedures” to assay the expression levels of 14-3-3ϵ (A–E) and 14-3-3σ (F–J). The data presented are representative of at least three independent experiments performed in triplicate (mean ± S.E. (error bars)). Statistical analysis was performed using unpaired Student's t test and two-way ANOVA tests comparing the test samples with their respective controls.
FIGURE 7.
FIGURE 7.
Suppression of 14-3-3ϵ and 14-3-3σ enhances TLR2-, TLR3-, TLR4-, TLR7/8-, and TLR9-mediated activation of NF-κB, IRF3, p38, and ERK1/2. U373-CD14 cells were pretreated with either control lamin A/C or 14-3-3ϵ or 14-3-3σ esiRNA to target their suppression. After 24 h, cells were stimulated with Pam3CSK4 (1 μg/ml; P3C), poly(I:C) (20 μg/ml; P(I:C)), LPS (1 μg/ml), R848 (1 μg/ml), and CpG (5 μg/ml) for 0–120 min as indicated. Next, the cell lysates were harvested, and NF-κB (phospho-p65 (A)), p38 (phospho-p38 (C)), and ERK1/2 (phospho-ERK1/2 (D)) signaling was assessed by immunoblot analysis with total protein serving as a loading control. Alternatively, the nuclear protein fraction was isolated, and immunoblot analysis was performed using an anti-IRF3 antibody (B). Equal protein loading was confirmed using an anti-lamin A/C antibody. Next, densitometry was performed to determine the relative activation of the indicated protein, whereby the band intensity of the activated protein was normalized relative to the respective total protein level. The data presented are representative of three independent experiments.
FIGURE 8.
FIGURE 8.
14-3-3ϵ and 14-3-3σ bind to the TLR adaptors, TRAF3 and TRAF6. A and B, HEK293-TLR3 cells were co-transfected with vectors encoding MyD88-c-myc, Mal-FLAG, TRIF-FLAG, TRAM-FLAG, or empty vector (EV) and with either 14-3-3ϵ-HA (A) or 14-3-3σ-HA (B). After 24 h, cells were stimulated with poly(I:C) (20 μg/ml) for 30 min as indicated. Thereafter, immunoprecipitation (IP) of 14-3-3ϵ (A) and 14-3-3σ (B) was performed using an anti-HA antibody as described under “Experimental Procedures.” C, HEK293 cells were cotransfected with vectors encoding TRAF3-FLAG, IKKϵ-FLAG, IRF3-FLAG, IRF7-FLAG, p38-FLAG, TRAF-6, 14-3-3ϵ-HA, or empty vector as indicated. After 24 h, immunoprecipitation was performed using an anti-HA antibody as described under “Experimental Procedures.” D, U373-CD14 cells were co-transfected with vectors encoding MyD88-FLAG, Mal-FLAG, TRIF-FLAG, TRAM-FLAG, or empty vector and with 14-3-3ϵ-HA. After 24 h, immunoprecipitation was performed using an anti-FLAG antibody as described under “Experimental Procedures.” The data presented are representative of two independent experiments. IB, immunoblot; WCL, whole cell lysate.
FIGURE 9.
FIGURE 9.
Cellular processes and diseases associated with 14-3-3ϵ and 14-3-3σ and interacting partners. The newly identified and verified 14-3-3ϵ and 14-3-3σ protein interacting partners, including MyD88, MAL, TRIF, TRAM, TRAF3, TRAF6 were uploaded onto Pathway Studio software (Ariadne Genomics). A and B, 14-3-3ϵ and 14-3-3σ and interacting partners were analyzed using Pathway Studio software for the cellular process network (A) and common diseases (B) shared between them. The dark highlighted circular/oval-shaped entities represent the 14-3-3 proteins and interacting partners. The rectangular entities indicate the cellular processes (A) and diseases (B) that are co-regulated by 14-3-3ϵ and 14-3-3σ and interacting partners.

Similar articles

Cited by

References

    1. Miggin S. M., O'Neill L. A. (2006) New insights into the regulation of TLR signaling. J. Leukoc. Biol. 80, 220–226 - PubMed
    1. Keating S. E., Baran M., Bowie A. G. (2011) Cytosolic DNA sensors regulating type I interferon induction. Trends Immunol. 32, 574–581 - PubMed
    1. Kumar H., Kawai T., Akira S. (2009) Pathogen recognition in the innate immune response. Biochem. J. 420, 1–16 - PubMed
    1. Vercammen E., Staal J., Beyaert R. (2008) Sensing of viral infection and activation of innate immunity by Toll-like receptor 3. Clin. Microbiol. Rev. 21, 13–25 - PMC - PubMed
    1. O'Neill L. A., Bowie A. G. (2007) The family of five. TIR domain-containing adaptors in Toll-like receptor signaling. Nat. Rev. 7, 353–364 - PubMed

Publication types