. 2012 Dec;11(12):1790-800.
doi: 10.1074/mcp.M112.020800. Epub 2012 Sep 13.

High-resolution mapping of linear antibody epitopes using ultrahigh-density peptide microarrays

Affiliations

High-resolution mapping of linear antibody epitopes using ultrahigh-density peptide microarrays

Søren Buus et al. Mol Cell Proteomics. 2012 Dec.

Abstract

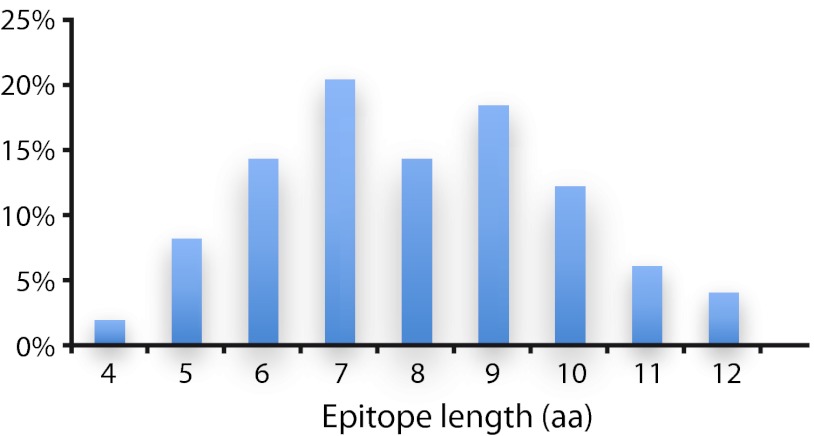
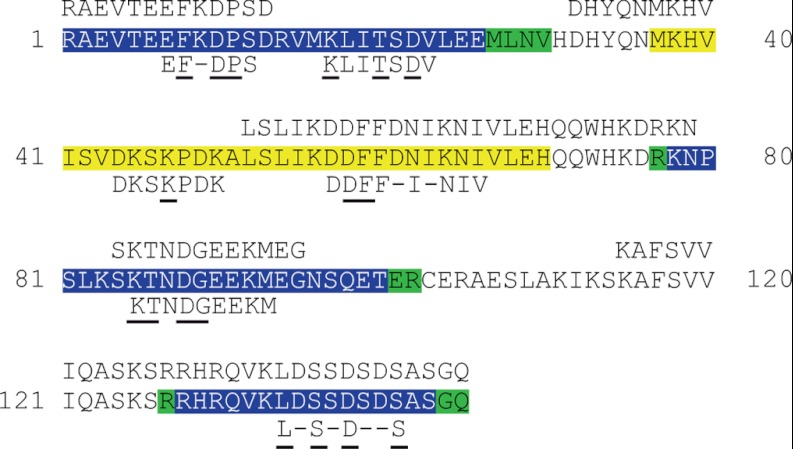
Antibodies empower numerous important scientific, clinical, diagnostic, and industrial applications. Ideally, the epitope(s) targeted by an antibody should be identified and characterized, thereby establishing antibody reactivity, highlighting possible cross-reactivities, and perhaps even warning against unwanted (e.g. autoimmune) reactivities. Antibodies target proteins as either conformational or linear epitopes. The latter are typically probed with peptides, but the cost of peptide screening programs tends to prohibit comprehensive specificity analysis. To perform high-throughput, high-resolution mapping of linear antibody epitopes, we have used ultrahigh-density peptide microarrays generating several hundred thousand different peptides per array. Using exhaustive length and substitution analysis, we have successfully examined the specificity of a panel of polyclonal antibodies raised against linear epitopes of the human proteome and obtained very detailed descriptions of the involved specificities. The epitopes identified ranged from 4 to 12 amino acids in size. In general, the antibodies were of exquisite specificity, frequently disallowing even single conservative substitutions. In several cases, multiple distinct epitopes could be identified for the same target protein, suggesting an efficient approach to the generation of paired antibodies. Two alternative epitope mapping approaches identified similar, although not necessarily identical, epitopes. These results show that ultrahigh-density peptide microarrays can be used for linear epitope mapping. With an upper theoretical limit of 2,000,000 individual peptides per array, these peptide microarrays may even be used for a systematic validation of antibodies at the proteomic level.


Figures

Fig. 1.
Fig. 1.
Image of a peptide microarray. Small section from a peptide array used for identification of different peptide epitopes, including the ones in Fig. 2A. The peptides were synthesized in quadratic fields defined by 2 × 2 mirrors (each mirror measuring 10 μm × 10 μm). One-mirror-wide empty regions separated the peptide fields. The fields were visualized via incubation with relevant rabbit antibodies followed by Alexa488-conjugated goat anti-rabbit IgG. The section shown corresponds to ca. 0.15% of the area of the entire array. Note that peptide synthesis at single mirror resolution can be observed.
Fig. 2.
Fig. 2.
Analyzing the length and fine specificity of polyclonal antibody epitopes. A, Bar chart displaying fluorescence signal obtained from antibodies binding to array-bound peptides synthesized as 15-mers overlapping by 14 amino acid residues. Rabbit antibodies were raised against a 145 residue PrEST coded by the human SNAPC1 gene. Alexa488-conjugated goat anti-rabbit IgG was used as secondary antibody. y-axis: fluorescence (AU); x-axis: residue number (n-terminal to the left). Each bar represents the signal obtained from a 15-mer peptide whose sequence starts at the indicated residue number. B, Different lengths of the SNAPC1 PrEST sequence (varying from 5-mers to 20-mers) were synthesized as overlapping peptides with an offset of one amino acid; that is, for each line the peptides were synthesized as n-mers with (n − 1) residue overlap. The fields were visualized by means of incubation with rabbit anti-SNAPC1 antibodies followed by Alexa488-conjugated goat anti-rabbit IgG. Results obtained from bar charts (as illustrated in Fig. 2A) are rendered as the PrEST sequence and color-coded to illustrate antibody-binding regions (yellow = low signal strength, green = intermediate signal strength, and blue = strong signal; colors from stronger signals are superimposed on colors from weaker signals). The lines represent results obtained with 20-mer peptides (upper line) down to 5-mer peptides (lower line); the peptide length of each line is indicated to the left.
Fig. 3.
Fig. 3.
Fine specificity described by exhaustive single substitution scans. Single substituted analog peptides, scanned through all 15 positions of the native peptide sequence and including all 20 naturally occurring amino acids, were synthesized and tested for binding to the appropriate anti-PrEST antibody. The relative signals of the analog peptide and of the native peptide are shown and color shaded so that reddish hues are assigned to substitutions resulting in reduced binding of the antibody. A, Position specific scoring matrix (PSSM) representing RS values of a single substitution scan of the 15-mer peptide RAEVTEEFKDPSDRV. B, The EF-DPS epitope identified from the RAEVTEEFKDPSDRV peptide. C, PSSM representing RS values of single substitution scans of the 15-mer peptide AVMKLITSDVLEEML. The PSSM matrices were also visualized as sequence logos using the Sequence2Logo server (http://www.cbs.dtu.dk/biotools/Seq2Logo-1.0/). D, The KLITSDV epitope identified from the AVMKLITSDVLEEML peptide.
Fig. 4.
Fig. 4.
Overview of the main experimental SSA data leading to the identification of 49 epitopes in 20 of 22 source PrEST proteins. The “epitope” box contains the source PrEST protein, the identified epitope, and the length of the epitope. The “signal” box contains the statistical analysis of the signal strength of the 15 repeats of the native peptide sequence with average (AVE), standard deviation (SD), and calculated variation coefficient (CV). The “ANOVA” box contains the ANOVA analysis of the exhaustive SSA with the F value and the associated probability. The final box shows the epitope identification with the 1% LSD value (shaded from most discriminatory in yellow to least discriminatory in red) obtained by Tukeys post-hoc analysis and used to identify the positions with average values (as in Fig. 3) that deviate significantly from 1.00 (nonsignificant values are shaded green; shading starts at 1 LSD and is maximal (red) at 0). Note that even weak signals can result in highly significant epitope calling (see, e.g., the SNAPC1 epitope DKSKPDK).
Fig. 5.
Fig. 5.
Length distribution (in amino acid residues) of 49 different SSA-determined epitopes. The y-axis is the number of epitopes found of the length indicated. The x-axis is the epitope length (i.e. number of residues covered by the epitope region).
Fig. 6.
Fig. 6.
The specificity of anti-PrEST polyclonal antibodies directed against SNAPC1 analyzed using different approaches. The top line indicates the peptide sequences identified via bacterial surface display. The center line contains the entire PrEST sequence representing the SNAPC1 protein, and the color encoding indicates the strength of the reactivity of the antibodies as detected in the peptide arrays by a 15-mer length scan with an offset of 1 (from Fig. 2B; blue, green, and yellow indicate strong, intermediate, and weak reactivity, respectively). The bottom line indicates the peptide sequences identified by the heat map approach (underlined residues indicates highly selective positions; dashes indicates nonselective interaction within an epitope).
Fig. 7.
Fig. 7.
Epitope context and structure. Epitopes identified by the peptide microarray approach and reported in Fig. 4 were mapped onto the known structure of the underlying proteins. Epitopes located on several different secondary structural elements, including parallel beta-sheets, loops, and helical regions, could be identified. In five of the seven cases shown here, several distinctly separated epitopes were identified.

References

    1. Gloriam D. E., Orchard S., Bertinetti D., Bjorling E., Bongcam-Rudloff E., Borrebaeck C. A., Bourbeillon J., Bradbury A. R., de Daruvar A., Dubel S., Frank R., Gibson T. J., Gold L., Haslam N., Herberg F. W., Hiltke T., Hoheisel J. D., Kerrien S., Koegl M., Konthur Z., Korn B., Landegren U., Montecchi-Palazzi L., Palcy S., Rodriguez H., Schweinsberg S., Sievert V., Stoevesandt O., Taussig M. J., Ueffing M., Uhlen M., van der Maarel S., Wingren C., Woollard P., Sherman D. J., Hermjakob H. (2010) A community standard format for the representation of protein affinity reagents. Mol. Cell. Proteomics 9, 1–10 - PMC - PubMed
    1. Dubel S., Stoevesandt O., Taussig M. J., Hust M. (2010) Generating recombinant antibodies to the complete human proteome. Trends Biotechnol. 28, 333–339 - PubMed
    1. Uhlen M., Oksvold P., Fagerberg L., Lundberg E., Jonasson K., Forsberg M., Zwahlen M., Kampf C., Wester K., Hober S., Wernerus H., Bjorling L., Ponten F. (2010) Towards a knowledge-based Human Protein Atlas. Nat. Biotechnol. 28, 1248–1250 - PubMed
    1. Taussig M. J., Stoevesandt O., Borrebaeck C. A., Bradbury A. R., Cahill D., Cambillau C., de Daruvar A., Dubel S., Eichler J., Frank R., Gibson T. J., Gloriam D., Gold L., Herberg F. W., Hermjakob H., Hoheisel J. D., Joos T. O., Kallioniemi O., Koegl M., Konthur Z., Korn B., Kremmer E., Krobitsch S., Landegren U., van der Maarel S., McCafferty J., Muyldermans S., Nygren P. A., Palcy S., Pluckthun A., Polic B., Przybylski M., Saviranta P., Sawyer A., Sherman D. J., Skerra A., Templin M., Ueffing M., Uhlen M. (2007) ProteomeBinders: planning a European resource of affinity reagents for analysis of the human proteome. Nat. Methods 4, 13–17 - PubMed
    1. Uhlen M., Graslund S., Sundstrom M. (2008) A pilot project to generate affinity reagents to human proteins. Nat. Methods 5, 854–855 - PubMed

Publication types