

Multiphoton multispectral fluorescence lifetime tomography for the evaluation of basal cell carcinomas
- PMID: 22984428
- PMCID: PMC3439453
- DOI: 10.1371/journal.pone.0043460
Multiphoton multispectral fluorescence lifetime tomography for the evaluation of basal cell carcinomas
Abstract
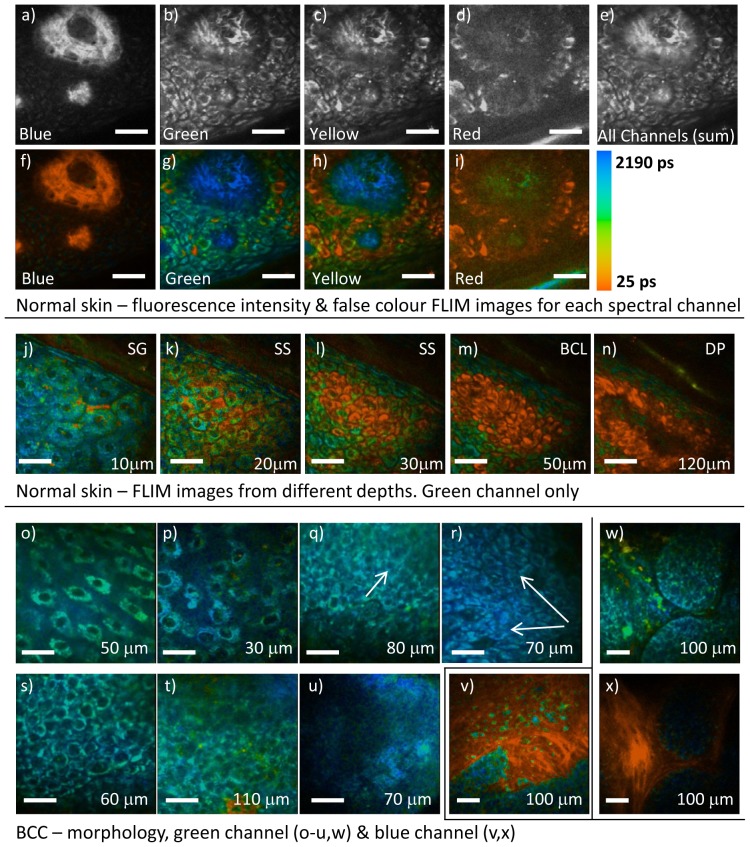
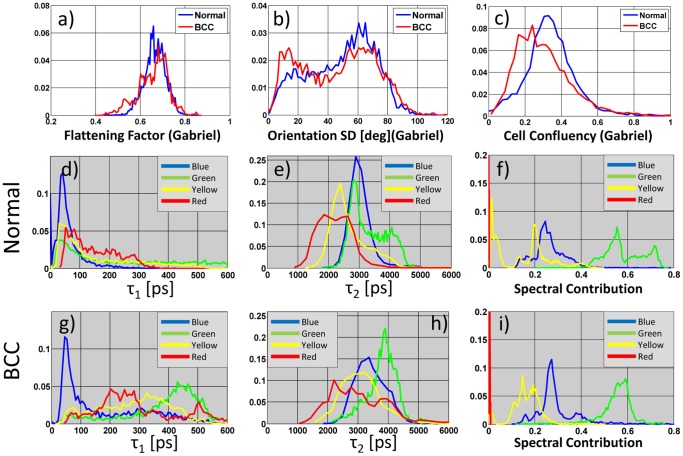
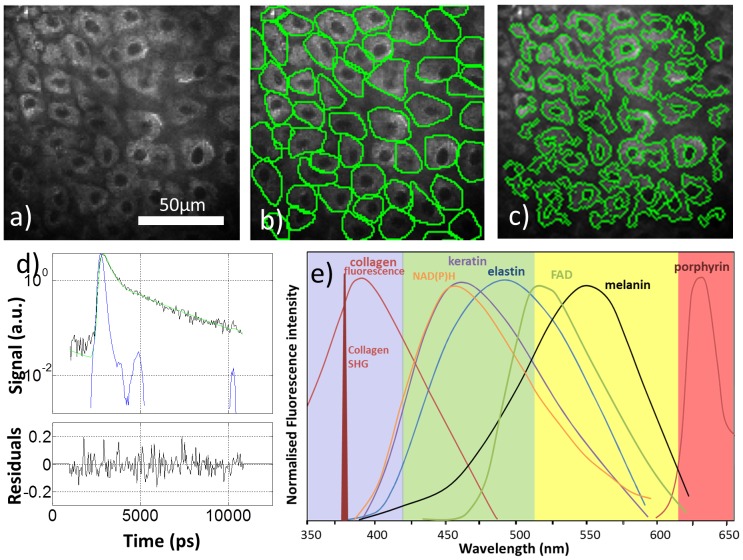
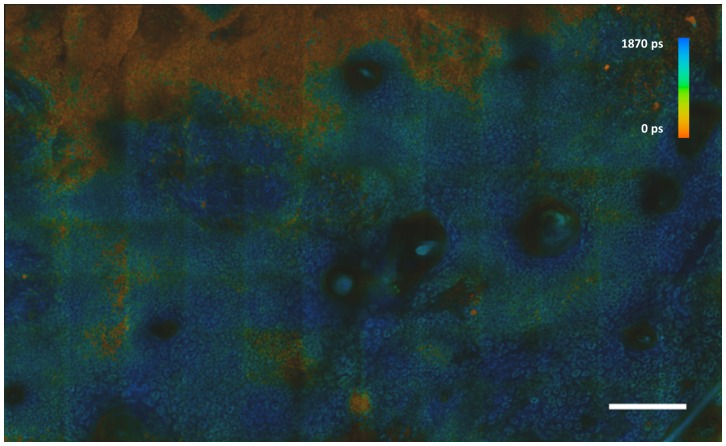
We present the first detailed study using multispectral multiphoton fluorescence lifetime imaging to differentiate basal cell carcinoma cells (BCCs) from normal keratinocytes. Images were acquired from 19 freshly excised BCCs and 27 samples of normal skin (in & ex vivo). Features from fluorescence lifetime images were used to discriminate BCCs with a sensitivity/specificity of 79%/93% respectively. A mosaic of BCC fluorescence lifetime images covering >1 mm(2) is also presented, demonstrating the potential for tumour margin delineation. Using 10,462 manually segmented cells from the image data, we quantify the cellular morphology and spectroscopic differences between BCCs and normal skin for the first time. Statistically significant increases were found in the fluorescence lifetimes of cells from BCCs in all spectral channels, ranging from 19.9% (425-515 nm spectral emission) to 39.8% (620-655 nm emission). A discriminant analysis based diagnostic algorithm allowed the fraction of cells classified as malignant to be calculated for each patient. This yielded a receiver operator characteristic area under the curve for the detection of BCC of 0.83. We have used both morphological and spectroscopic parameters to discriminate BCC from normal skin, and provide a comprehensive base for how this technique could be used for BCC assessment in clinical practice.
Conflict of interest statement
Figures
References
-
- Diepgen TL, Mahler V (2002) The epidemiology of skin cancer. Br J Dermatol 146 Suppl 61: 1–6. - PubMed
-
- Demers AA, Nugent Z, Mihalcioiu C, Wiseman MC, Kliewer EV (2005) Trends of nonmelanoma skin cancer from 1960 through 2000 in a Canadian population. Journal of the American Academy of Dermatology 53: 320–328. - PubMed
-
- Staples MP, Elwood M, Burton RC, Williams JL, Marks R, et al. (2006) Non-melanoma skin cancer in Australia: the 2002 national survey and trends since 1985. Med J Aust 184: 6–10. - PubMed
-
- Christenson LJ, Borrowman TA, Vachon CM, Tollefson MM, Otley CC, et al. (2005) Incidence of basal cell and squamous cell carcinomas in a population younger than 40 years. Jama-Journal of the American Medical Association 294: 681–690. - PubMed
-
- Mogensen M, Jemec GBE (2007) Diagnosis of Nonmelanoma Skin Cancer/Keratinocyte Carcinoma: A Review of Diagnostic Accuracy of Nonmelanoma Skin Cancer Diagnostic Tests and Technologies. Dermatologic Surgery 33: 1158–1174. - PubMed
