

A general HIV incidence inference scheme based on likelihood of individual level data and a population renewal equation
- PMID: 22984497
- PMCID: PMC3440384
- DOI: 10.1371/journal.pone.0044377
A general HIV incidence inference scheme based on likelihood of individual level data and a population renewal equation
Abstract
We derive a new method to estimate the age specific incidence of an infection with a differential mortality, using individual level infection status data from successive surveys. The method consists of a) an SI-type model to express the incidence rate in terms of the prevalence and its derivatives as well as the difference in mortality rate, and b) a maximum likelihood approach to estimate the prevalence and its derivatives. Estimates can in principle be obtained for any chosen age and time, and no particular assumptions are made about the epidemiological or demographic context. This is in contrast with earlier methods for estimating incidence from prevalence data, which work with aggregated data, and the aggregated effect of demographic and epidemiological rates over the time interval between prevalence surveys. Numerical simulation of HIV epidemics, under the presumption of known excess mortality due to infection, shows improved control of bias and variance, compared to previous methods. Our analysis motivates for a) effort to be applied to obtain accurate estimates of excess mortality rates as a function of age and time among HIV infected individuals and b) use of individual level rather than aggregated data in order to estimate HIV incidence rates at times between two prevalence surveys.
Conflict of interest statement
Figures
 was chosen as follow. a) Period 1, 2 and 3: for times in the interval
  ,
,  for each age from 15 to 16,
  for each age from 17 to 22,
  for each age from 23 to 35, and
  for ages greater than 35. b) Period 4: for times in the interval
  ,
,  for each age from 15 to 16,
  for each age from 17 to 22,
  for each age from 23 to 35, and
  for ages greater than 35.
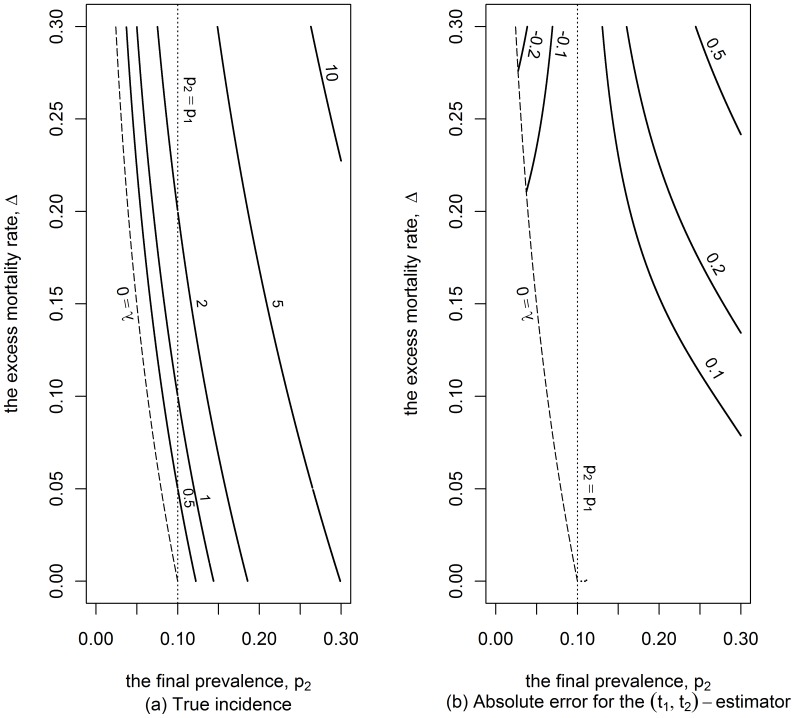
 is 0.1 and the time between the two surveys is 5 years.
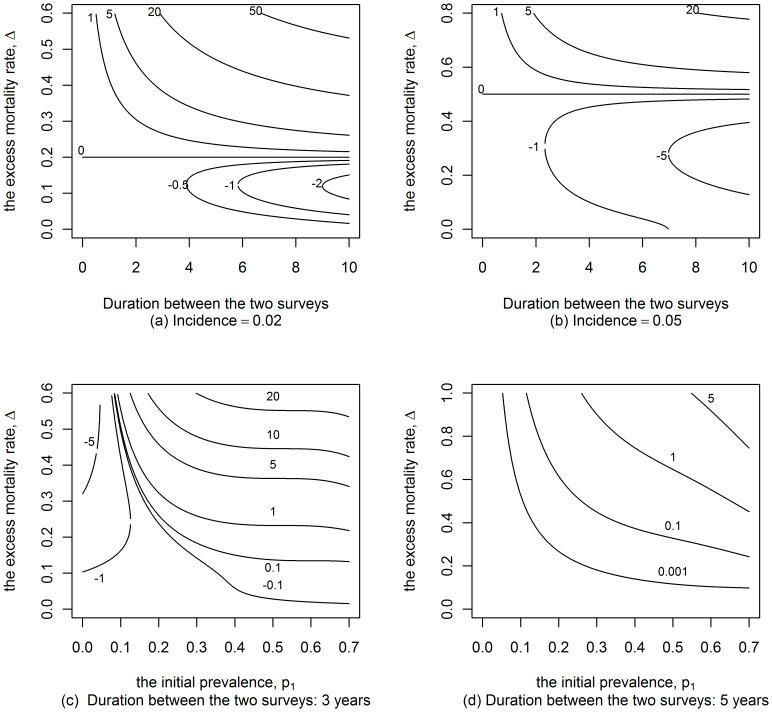
 varies.
References
-
- Brookmeyer R, Quinn TC (1995) Estimation of Current Human Immunodeficiency Virus Incidence Rates from a Cross-Sectional Survey Using Early Diagnostic Tests. Am J Epidemiology 141: 166–172. - PubMed
-
- Hargrove JW, Humphrey JH, Mutasa K, Parekh BS, McDougal JS, et al. (2008) Improved HIV-1 incidence estimates using the BED capture enzyme immunoassay. Aids 22: 511–518. - PubMed
-
- Janssen RS, Satten GA, Stramer SL, Rawal BD, O'Brien TR, et al. (1998) New testing strategy to detect early HIV-1 infection for use in incidence estimates and for clinical and prevention purposes. Jama 280: 42–48. - PubMed
-
- McDougal JS, Parekh BS, Peterson ML, Branson BM, Dobbs T, et al. (2006) Comparison of HIV type 1 incidence observed during longitudinal follow-up with incidence estimated by cross-sectional analysis using the BED capture enzyme immunoassay. AIDS Res Hum Retroviruses 22: 945–952. - PubMed
Publication types
MeSH terms
LinkOut - more resources
Full Text Sources
Medical
