

Negative feedback enables fast and flexible collective decision-making in ants
- PMID: 22984518
- PMCID: PMC3440389
- DOI: 10.1371/journal.pone.0044501
Negative feedback enables fast and flexible collective decision-making in ants
Abstract
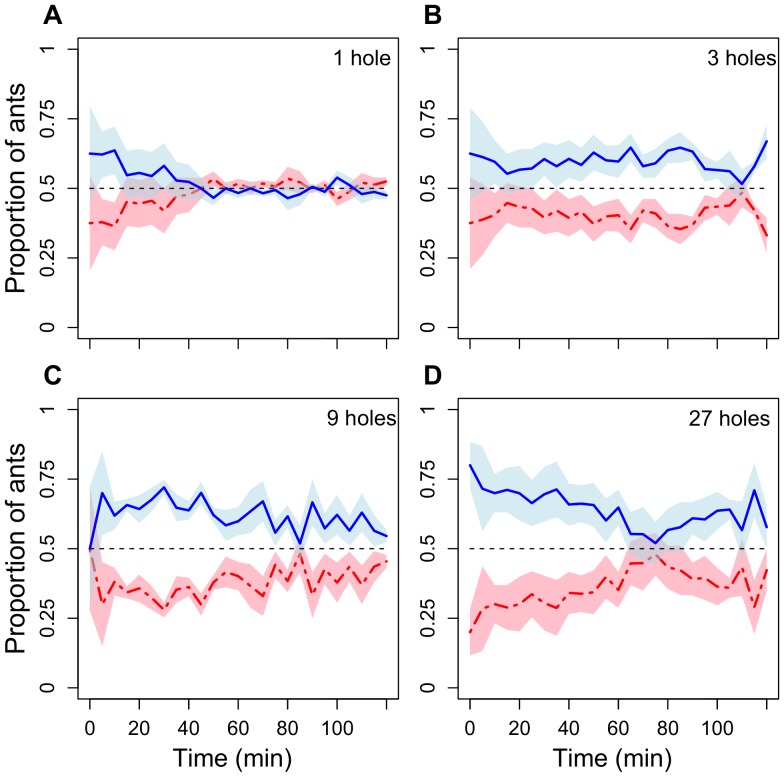
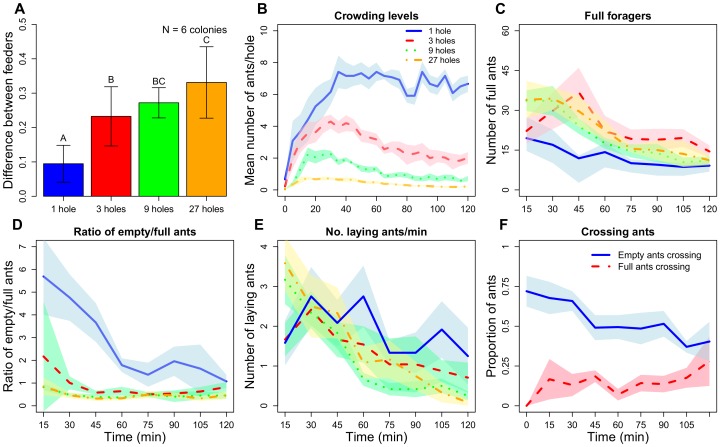
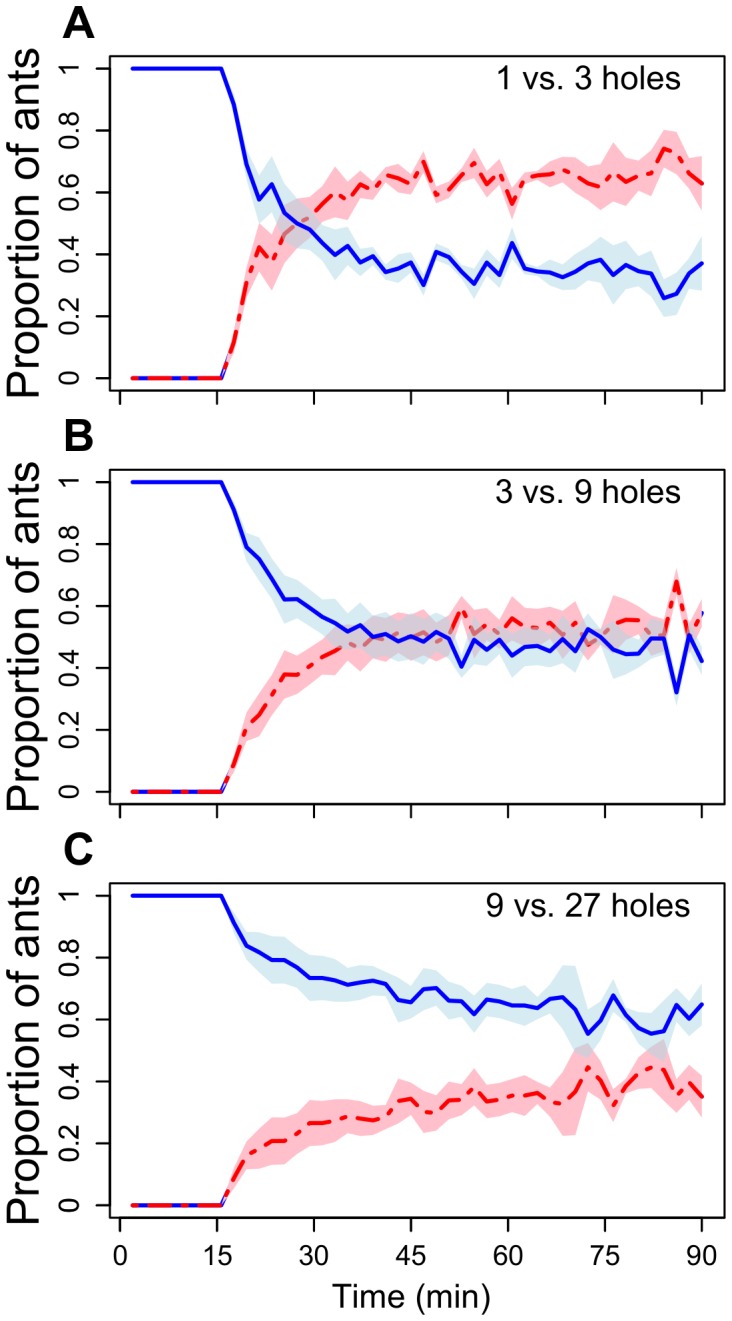
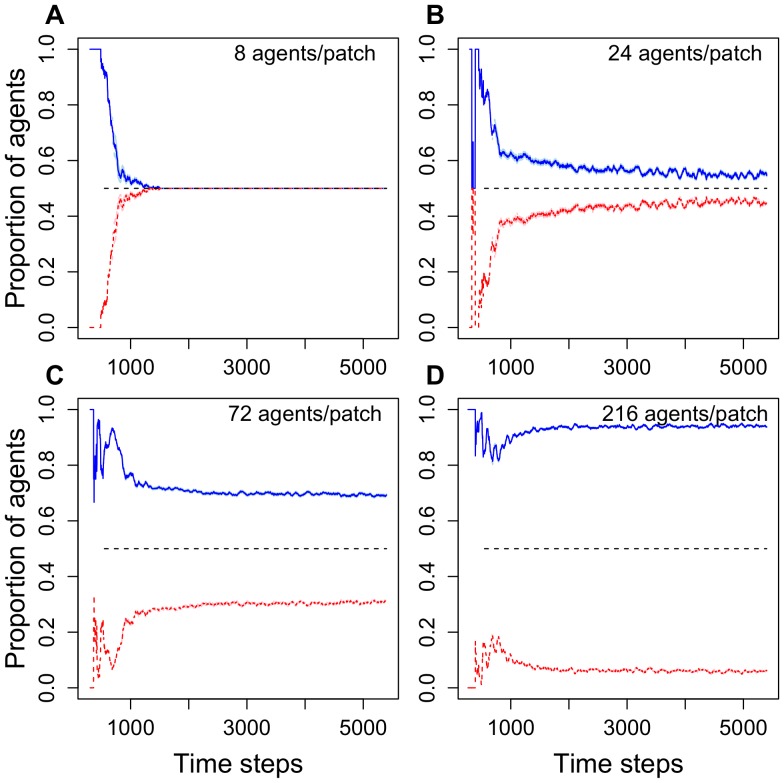
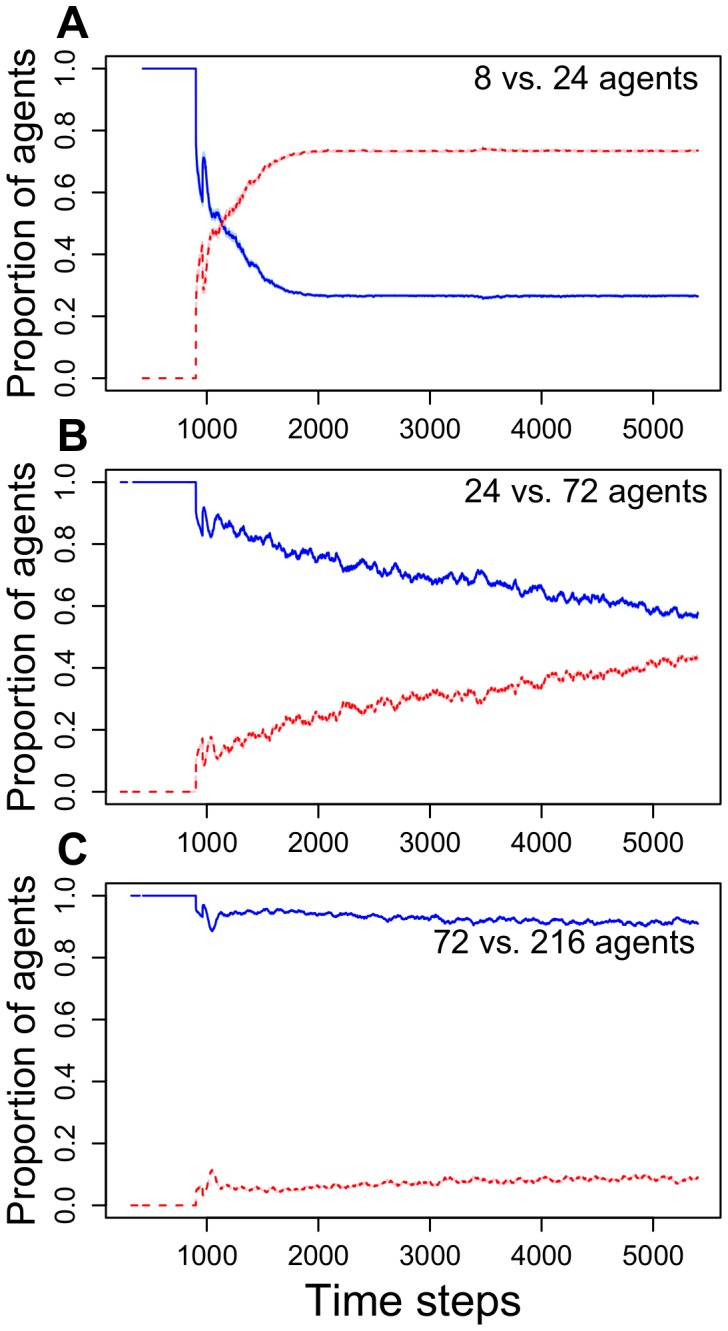
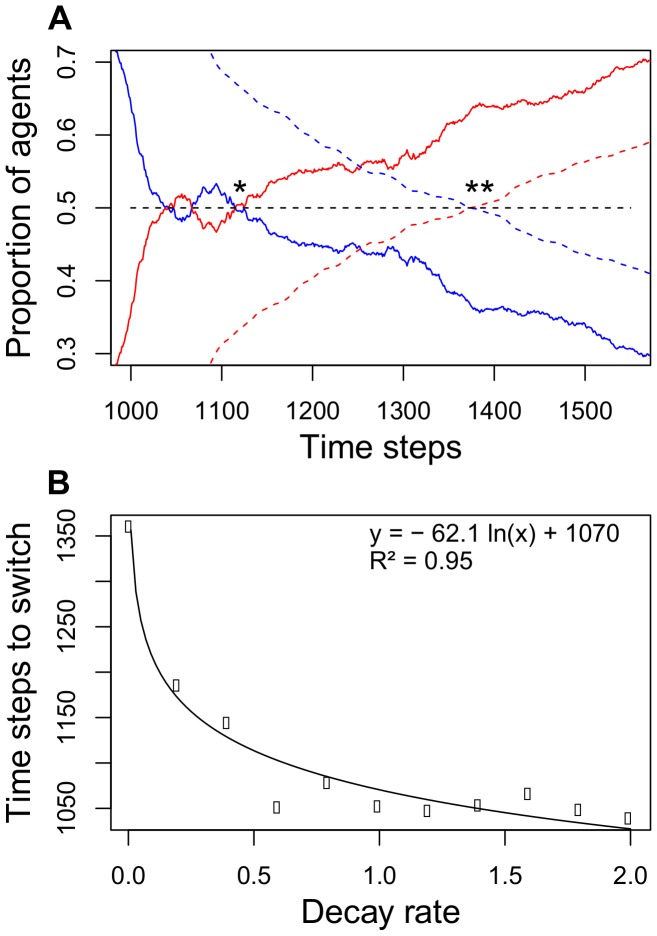
Positive feedback plays a major role in the emergence of many collective animal behaviours. In many ants pheromone trails recruit and direct nestmate foragers to food sources. The strong positive feedback caused by trail pheromones allows fast collective responses but can compromise flexibility. Previous laboratory experiments have shown that when the environment changes, colonies are often unable to reallocate their foragers to a more rewarding food source. Here we show both experimentally, using colonies of Lasius niger, and with an agent-based simulation model, that negative feedback caused by crowding at feeding sites allows ant colonies to maintain foraging flexibility even with strong recruitment to food sources. In a constant environment, negative feedback prevents the frequently found bias towards one feeder (symmetry breaking) and leads to equal distribution of foragers. In a changing environment, negative feedback allows a colony to quickly reallocate the majority of its foragers to a superior food patch that becomes available when foraging at an inferior patch is already well underway. The model confirms these experimental findings and shows that the ability of colonies to switch to a superior food source does not require the decay of trail pheromones. Our results help to resolve inconsistencies between collective foraging patterns seen in laboratory studies and observations in the wild, and show that the simultaneous action of negative and positive feedback is important for efficient foraging in mass-recruiting insect colonies.
Conflict of interest statement
Figures
Similar articles
-
How to not get stuck-negative feedback due to crowding maintains flexibility in ant foraging.J Theor Biol. 2014 Nov 7;360:172-180. doi: 10.1016/j.jtbi.2014.07.005. Epub 2014 Jul 14. J Theor Biol. 2014. PMID: 25034339
-
An agent-based model to investigate the roles of attractive and repellent pheromones in ant decision making during foraging.J Theor Biol. 2008 Nov 21;255(2):250-8. doi: 10.1016/j.jtbi.2008.08.015. Epub 2008 Aug 22. J Theor Biol. 2008. PMID: 18778716
-
Ant foraging on complex trails: route learning and the role of trail pheromones in Lasius niger.J Exp Biol. 2013 Jan 15;216(Pt 2):188-97. doi: 10.1242/jeb.076570. Epub 2012 Sep 12. J Exp Biol. 2013. PMID: 22972897
-
Information flow, opinion polling and collective intelligence in house-hunting social insects.Philos Trans R Soc Lond B Biol Sci. 2002 Nov 29;357(1427):1567-83. doi: 10.1098/rstb.2002.1066. Philos Trans R Soc Lond B Biol Sci. 2002. PMID: 12495514 Free PMC article. Review.
-
Complexity of environment and parsimony of decision rules in insect societies.Biol Bull. 2002 Jun;202(3):268-74. doi: 10.2307/1543478. Biol Bull. 2002. PMID: 12086999 Review.
Cited by
-
Composite collective decision-making.Proc Biol Sci. 2015 Jun 22;282(1809):20142723. doi: 10.1098/rspb.2014.2723. Proc Biol Sci. 2015. PMID: 26019155 Free PMC article.
-
Experimental investigation of ant traffic under crowded conditions.Elife. 2019 Oct 22;8:e48945. doi: 10.7554/eLife.48945. Elife. 2019. PMID: 31635695 Free PMC article.
-
Emergent weak home-range behaviour without spatial memory.R Soc Open Sci. 2016 Jun 29;3(6):160214. doi: 10.1098/rsos.160214. eCollection 2016 Jun. R Soc Open Sci. 2016. PMID: 27429778 Free PMC article.
-
Negative feedback in ants: crowding results in less trail pheromone deposition.J R Soc Interface. 2013 Jan 30;10(81):20121009. doi: 10.1098/rsif.2012.1009. Print 2013 Apr 6. J R Soc Interface. 2013. PMID: 23365196 Free PMC article.
-
Ontogeny of collective behaviour.Philos Trans R Soc Lond B Biol Sci. 2023 Apr 10;378(1874):20220065. doi: 10.1098/rstb.2022.0065. Epub 2023 Feb 20. Philos Trans R Soc Lond B Biol Sci. 2023. PMID: 36802780 Free PMC article. Review.
References
-
- Buhl J, Sumpter DJT, Couzin ID, Hale JJ, Despland E, et al. (2006) From disorder to order in marching locusts. Science 312: 1402–1406. - PubMed
-
- Camazine S, Deneubourg JL, Franks NR, SneydJ, Theraulaz G, et al... (2001) Self-Organization in Biological Systems. Princeton, NJ: Princeton University Press.
Publication types
MeSH terms
Substances
LinkOut - more resources
Full Text Sources
