. 2012;7(9):e44603.
doi: 10.1371/journal.pone.0044603. Epub 2012 Sep 11.

Fasting enhances the response of glioma to chemo- and radiotherapy

Affiliations

Fasting enhances the response of glioma to chemo- and radiotherapy

Fernando Safdie et al. PLoS One. 2012.

Abstract

Background: Glioma, including anaplastic astrocytoma and glioblastoma multiforme (GBM) are among the most commonly diagnosed malignant adult brain tumors. GBM is a highly invasive and angiogenic tumor, resulting in a 12 to 15 months median survival. The treatment of GBM is multimodal and includes surgical resection, followed by adjuvant radio-and chemotherapy. We have previously reported that short-term starvation (STS) enhances the therapeutic index of chemo-treatments by differentially protecting normal cells against and/or sensitizing tumor cells to chemotoxicity.

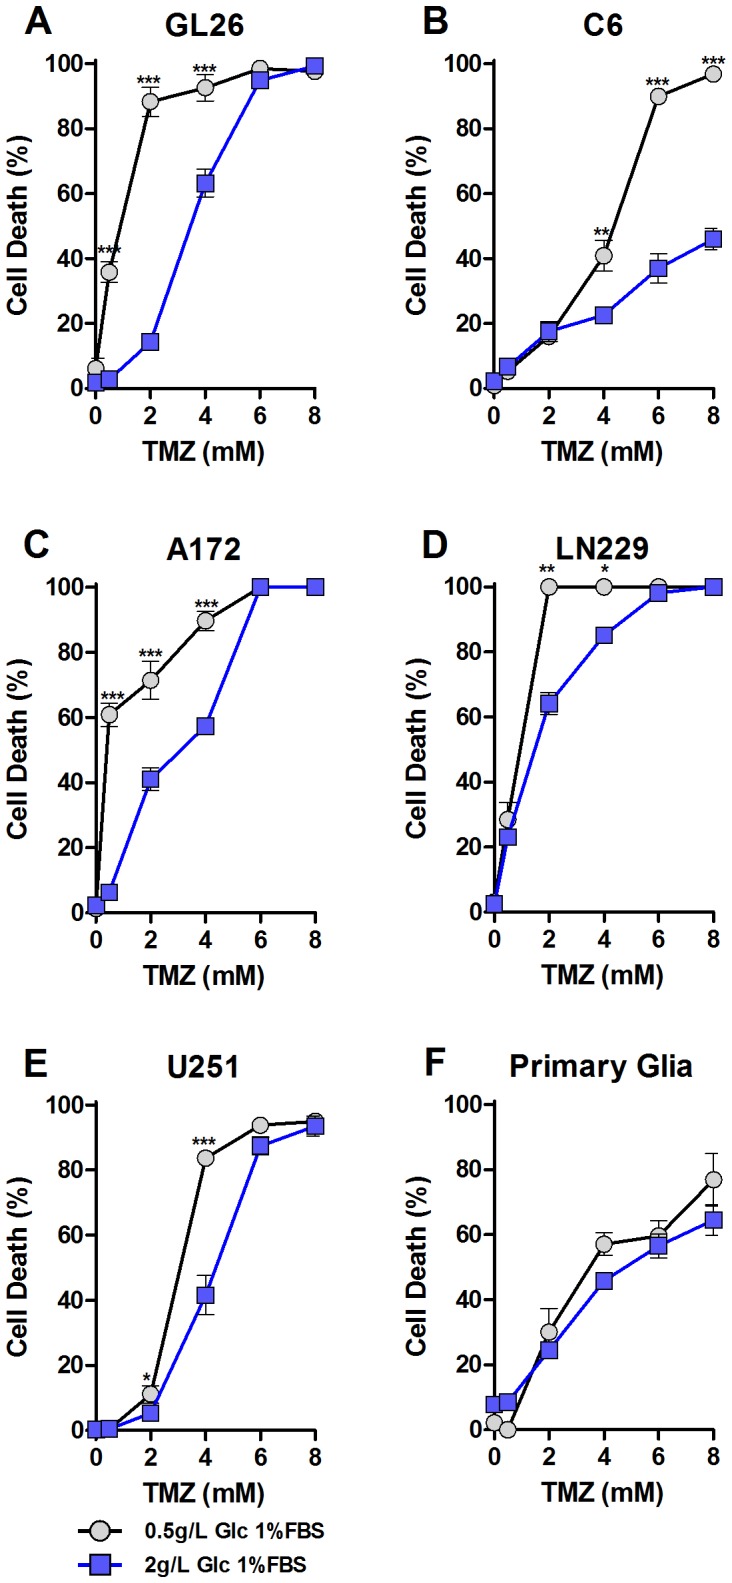
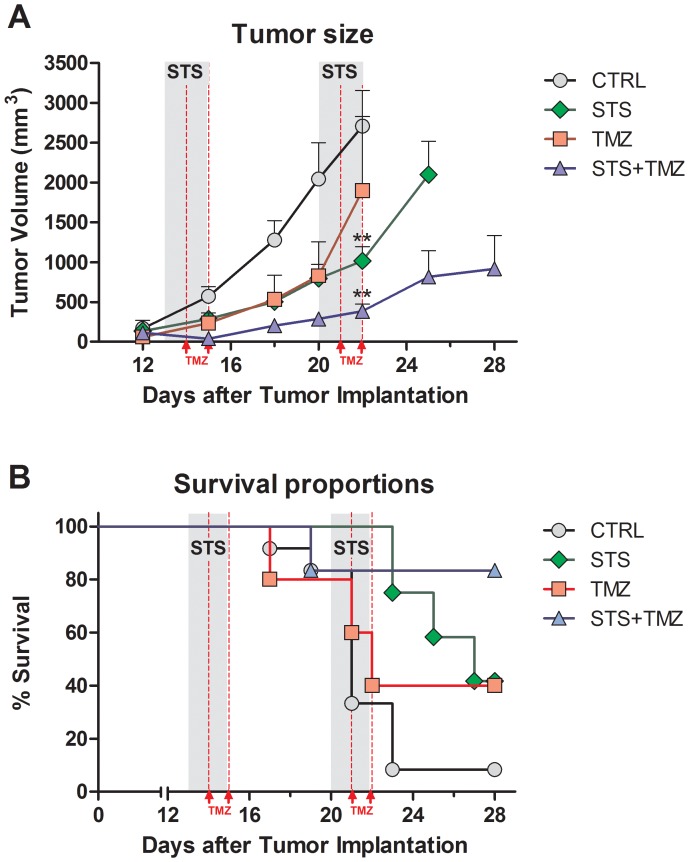
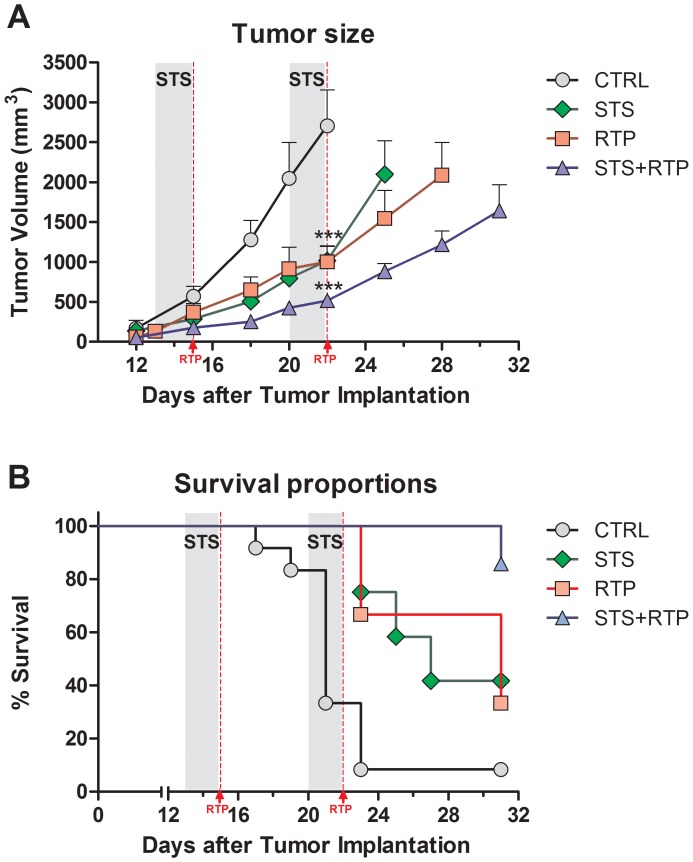
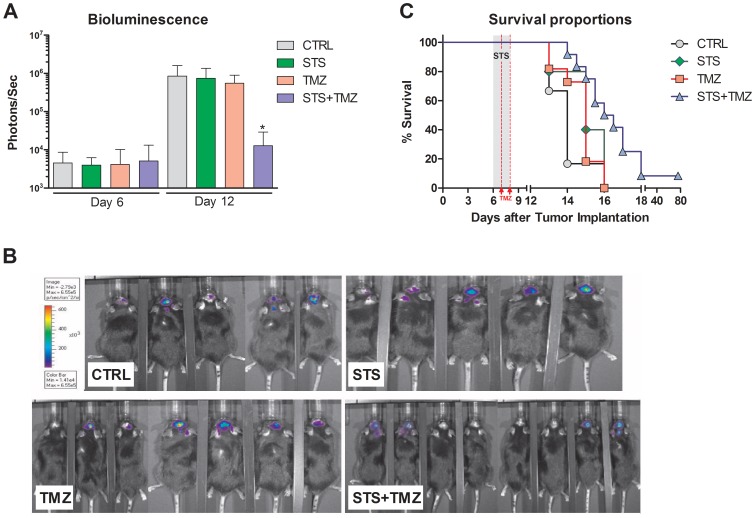
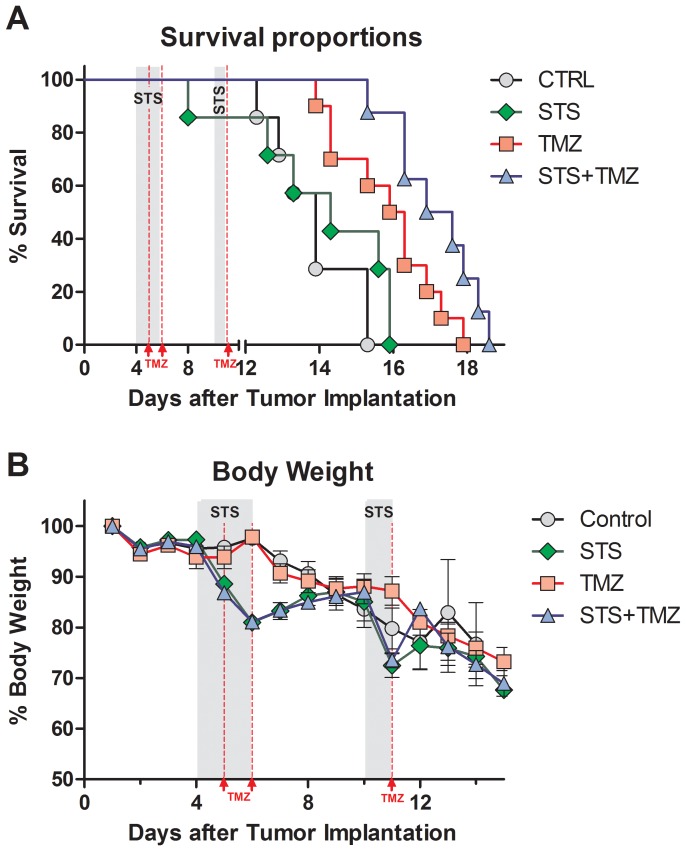
Methodology and principal findings: To test the effect of starvation on glioma cells in vitro, we treated primary mouse glia, murine GL26, rat C6 and human U251, LN229 and A172 glioma cells with Temozolomide in ad lib and STS mimicking conditions. In vivo, mice with subcutaneous or intracranial models of GL26 glioma were starved for 48 hours prior to radio- or chemotherapy and the effects on tumor progression and survival were measured. Starvation-mimicking conditions sensitized murine, rat and human glioma cells, but not primary mixed glia, to chemotherapy. In vivo, starvation for 48 hours, which causes a significant reduction in blood glucose and circulating insulin-like growth factor 1 (IGF-1) levels, sensitized both subcutaneous and intracranial glioma models to radio-and chemotherapy.

Conclusion: Starvation-induced cancer sensitization to radio- or chemotherapy leads to extended survival in the in vivo glioma models tested. These results indicate that fasting and fasting-mimicking interventions could enhance the efficacy of existing cancer treatments against aggressive glioma in patients.


Conflict of interest statement

Competing Interests: The authors have read the journal’s policy and have the following conflicts: VDL has founded L-Nutra and is a consultant for Amore Pacific. This does not alter the authors' adherence to all the PLoS ONE policies on sharing data and materials. All other authors declare no competing interests.

Figures

Figure 1
Figure 1. Glucose restriciton sensitizes Glioma Cells to Temozolomide Treatment in vitro.
Glioma cell lines GL26, C6, LN229, A172 and U251 as well as murine primary mixed glial cell lines were tested for glucose-restriction induced sensitization to Temozolomide. Cells were incubated in low glucose (0.5 g/L) or normal glucose (2.0 g/L) media, supplemented with 1% FBS for 24 hours. Low glucose modeling STS conditions sensitized murine GL26 glioma cells (A), rat C6 glioma cells (B) and human A172 (C), LN229 (D), U251 glioma cells (E) to TMZ in vitro. (F) Murine primary mixed glial cells were used to represent matching normal cells. Percent cell death was determined based on quantitative measurements of lactate dehydrogenase (LDH) release after 24 hour treatment with 0–8 mM TMZ. All data presented as mean ± SEM; ** p<0.01; *** p<0.001, Student’s t-test, two-tailed.
Figure 2
Figure 2. Enhanced Chemotherapy by Fasting in a murine GL26 Glioma Model extends onset of Morbidity in Tumor-bearing Animals.
(A) Subcutaneous tumor progression of murine GL26 glioma is shown as total tumor volume in mm3. Tumor measurement was started once the tumor became palpable under skin at day 12. Control animals (N = 12) received no treatment and tumor progressed rapidly. STS (N = 12) and STS+TMZ group (N = 6) were deprived of food for two 48 hour cycles (day 13 to day 15 and day 20 to day 22, grey area). TMZ animals (N = 5) received 15 mg/kg/day TMZ (red lines), totalling 30 mg/kg for each treatment cycle. STS+TMZ animals were injected at 24 hours and 48 hours of fasting with 15 mg/kg TMZ per injection, totalling 30 mg/kg/cycle. Animals from STS and STS+TMZ groups showed reduced tumor progression and could therefore be monitored for a prolonged period compared to animals from the control and TMZ group. All data presented as mean ± SEM; ** p<0.01, ANOVA, Tukey’s multiple comparison, compared to control. (B) Morbidity of animals inoculated subcutaneous with GL26 glioma. Animals were euthanized once tumor volume exceeded 2500 mm3 or based on overall appearance and health status. Curve comparison with Log-Rank test (Mantel-Cox, *** p<0.05).
Figure 3
Figure 3. Enhanced Radiotherapy (RTP) by Fasting in a murine GL26 Glioma Model.
(A) Subcutaneous tumor progression of murine GL26 glioma is shown by total tumor volume in mm3. Tumor measurement was started once the tumor became palpable under skin at day 12. Control animals (N = 12) received no treatment and tumor progressed rapidly. STS (N = 12) and STS+RTP group (N = 9) were deprived of food for two 48 hour cycles (day 13 to day 15 and day 20 to day 22, grey area). RTP and STS+RTP animals (N = 9) were treated with 5 Gy at day 15 and 2.5 Gy at day 22, totalling 7.5 Gy for the combined radiotherapy treatment; 2nd dose was lowered to 2.5 Gy to reduce radiotoxicity. Animals from STS, RTP and STS+RTP groups showed reduced tumor progression and could therefore be monitored for a prolonged period compared to animals from the control group. All data presented as mean ± SEM; *** p<0.001, ANOVA, Tukey’s multiple comparison, compared to control at day 22. (B) Morbidity of animals inoculated subcutaneously with GL26 glioma and treated with either radiotherapy, two 48 hour fasting cycles or the combination of both (STS+RTP). Animals were considered moribund once tumor volume exceeded 2500 mm3 or based on overall appearance and health status. Curve comparison with Log-Rank test (Mantel-Cox; ** p<0.01).
Figure 4
Figure 4. Fasting augments Effects of TMZ-Chemotherapy in the intracranial GL26luc Glioma Model.
(A) Bioluminescence expression at day 6 vs. day 12 after tumor inoculation. Animals at day 6 were randomized into the four experimental groups (Control, N = 6; TMZ, N = 5; STS, N = 11; or STS+TMZ, N = 12) and treatment was initiated. Tumor progression was monitored at day 12 to determine treatment benefits. Bioluminescence signaling measured as photons/sec. All data presented as mean ± SEM; * p<0.05, ANOVA, Tukey’s multiple comparison, compared to control at day 12. (B) Bioluminescence imaging of GL26luc glioma bearing C57BL/6 mice at day 12 after intracranial tumor implantation. Animals are shown according to experimental group. (C) Morbididty rate comparison of animals inoculated intracranially with GL26luc glioma cells. STS and STS+TMZ animals were fasted for 48 hours starting at day 6 (grey area). TMZ and STS+TMZ animals received i.v. injections of 15 mg/kg Temozolomide at day 7 and day 8 (red lines), totalling 30 mg/kg/cycle. Curve comparison with Log-Rank test (Mantel-Cox; * p<0.05).
Figure 5
Figure 5. Two fasting cycles augment effects of TMZ-Chemotherapy in the intracranial GL26 Glioma Model.
(A) Morbidity rate comparison of animals inoculated intracranially with GL26luc glioma cells. Animals at day 4 were randomized into the four experimental groups (Control, N = 7; TMZ, N = 7; STS, N = 10; or STS+TMZ, N = 8). Treatment of all experimental groups was initiated earlier to allow increased response to short-term starvation and/or TMZ. STS and STS+TMZ animals were fasted for 48 hours starting at day 4 followed by a second 24 hour fasting regiment at day 10 (grey areas). TMZ and STS+TMZ animals received i.p. injections of 15 mg/kg Temozolomide at day 5 and day 6 to match the first STS cycle and at day 11 to match the shorter second cycle (red lines), totalling 45 mg/kg. Curve comparison with Log-Rank test (Mantel-Cox; *** p<0.001). (B) Body weight profile for glioma-bearing animals receiving multiple rounds of either short-term starvation, TMZ-treatment or both. STS and STS+TMZ animals initially reduce body weight during STS cycles (grey area) but regain the weight of untreated control and TMZ-treated animals rapidly after refeeding.

Similar articles

Cited by

References

    1. Ohgaki H, Kleihues P (2005) Epidemiology and etiology of gliomas. Acta Neuropathol 109: 93–108. - PubMed
    1. Purow B, Schiff D (2009) Advances in the genetics of glioblastoma: are we reaching critical mass? Nat Rev Neurol 5: 419–426. - PMC - PubMed
    1. Stupp R, Mason WP, van den Bent MJ, Weller M, Fisher B, et al. (2005) Radiotherapy plus concomitant and adjuvant temozolomide for glioblastoma. N Engl J Med 352: 987–996. - PubMed
    1. Stupp R, Dietrich PY, Ostermann Kraljevic S, Pica A, Maillard I, et al. (2002) Promising survival for patients with newly diagnosed glioblastoma multiforme treated with concomitant radiation plus temozolomide followed by adjuvant temozolomide. J Clin Oncol 20: 1375–1382. - PubMed
    1. Zimmerman HM (1955) The nature of gliomas as revealed by animal experimentation. Am J Pathol 31: 1–29. - PMC - PubMed

Publication types

MeSH terms