

Nematode spatial and ecological patterns from tropical and temperate rainforests
- PMID: 22984536
- PMCID: PMC3439412
- DOI: 10.1371/journal.pone.0044641
Nematode spatial and ecological patterns from tropical and temperate rainforests
Abstract
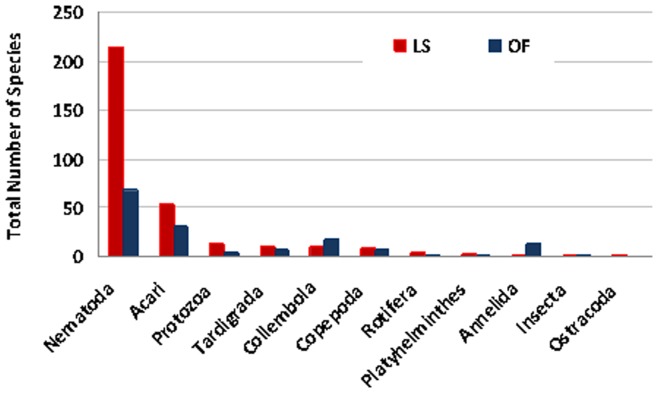
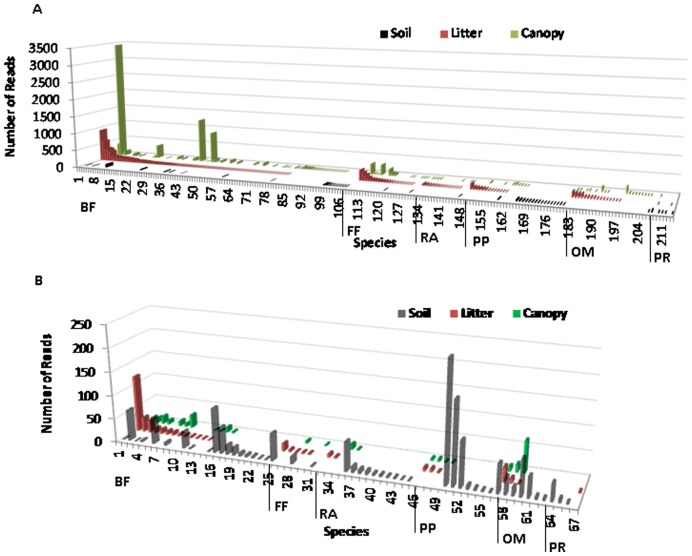
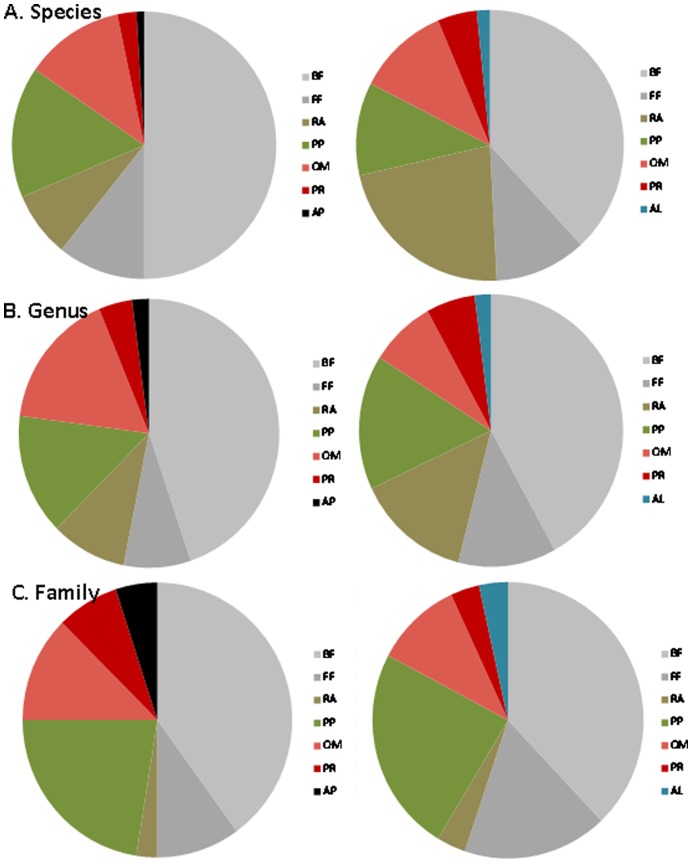
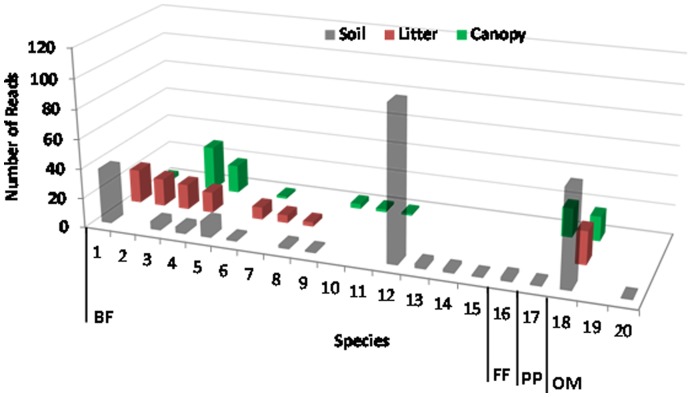
Large scale diversity patterns are well established for terrestrial macrobiota (e.g. plants and vertebrates), but not for microscopic organisms (e.g. nematodes). Due to small size, high abundance, and extensive dispersal, microbiota are assumed to exhibit cosmopolitan distributions with no biogeographical patterns. This assumption has been extrapolated from local spatial scale studies of a few taxonomic groups utilizing morphological approaches. Recent molecularly-based studies, however, suggest something quite opposite. Nematodes are the most abundant metazoans on earth, but their diversity patterns are largely unknown. We conducted a survey of nematode diversity within three vertical strata (soil, litter, and canopy) of rainforests at two contrasting latitudes in the North American meridian (temperate: the Olympic National Forest, WA, U.S.A and tropical: La Selva Biological Station, Costa Rica) using standardized sampling designs and sample processing protocols. To describe nematode diversity, we applied an ecometagenetic approach using 454 pyrosequencing. We observed that: 1) nematode communities were unique without even a single common species between the two rainforests, 2) nematode communities were unique among habitats in both rainforests, 3) total species richness was 300% more in the tropical than in the temperate rainforest, 4) 80% of the species in the temperate rainforest resided in the soil, whereas only 20% in the tropics, 5) more than 90% of identified species were novel. Overall, our data provided no support for cosmopolitanism at both local (habitats) and large (rainforests) spatial scales. In addition, our data indicated that biogeographical patterns typical of macrobiota also exist for microbiota.
Conflict of interest statement
Figures
References
-
- Baas Becking LGM (1934) Geobiologie of inleiding tot de milieukunde. VP Van Stockkum & Zoon, The Hague, The Netherlands.
-
- Finlay BJ (2002) Global dispersal of free-living microbial eukaryote species. Science 296: 1061–1063. - PubMed
-
- Fenchel T, Finlay BJ (2004) The ubiquity of small species: patterns of local and global diversity. BioScience 54: 777–784.
-
- Finlay BJ, Corliss JO, Esteban G, Fenchel T (1996) Biodiversity at the microbial level: The number of free-living ciliates in the biosphere. Quart Rev Biol 71: 221–237.
-
- Fenchel T, Esteban GF, Finlay BJ (1997) Local vs. global diversity of microorganisms: Cryptic diversity of ciliated protozoa. Oikos 80: 220–225.
Publication types
MeSH terms
Substances
LinkOut - more resources
Full Text Sources
