. 2012;7(9):e44697.
doi: 10.1371/journal.pone.0044697. Epub 2012 Sep 11.

A novel stress-induced sugarcane gene confers tolerance to drought, salt and oxidative stress in transgenic tobacco plants

Affiliations

A novel stress-induced sugarcane gene confers tolerance to drought, salt and oxidative stress in transgenic tobacco plants

Kevin Begcy et al. PLoS One. 2012.

Abstract

Background: Drought is a major abiotic stress that affects crop productivity worldwide. Sugarcane can withstand periods of water scarcity during the final stage of culm maturation, during which sucrose accumulation occurs. Meanwhile, prolonged periods of drought can cause severe plant losses.

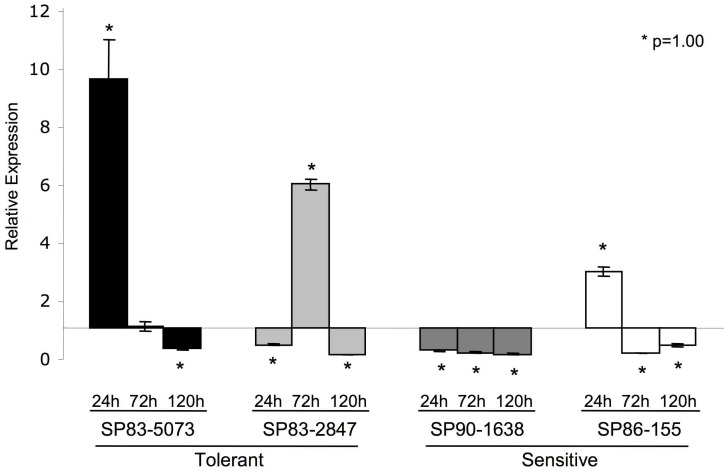
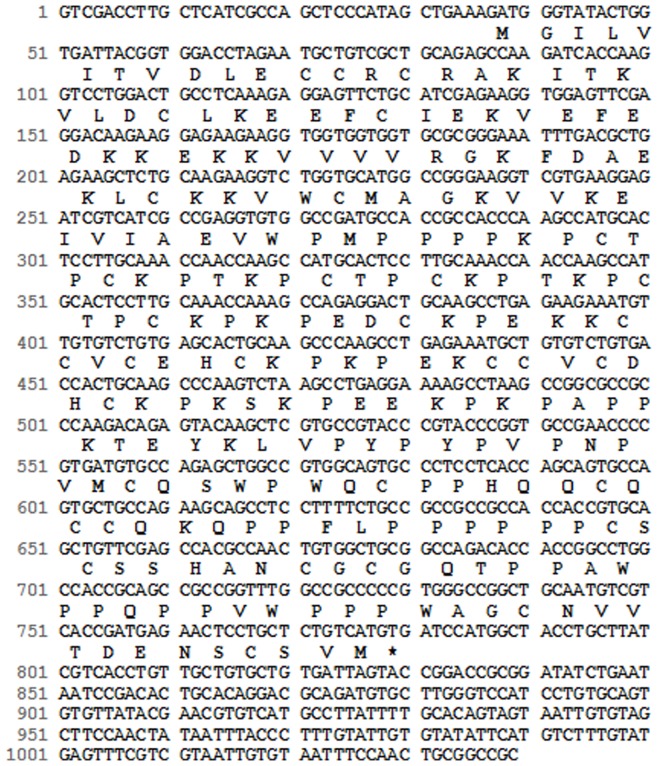
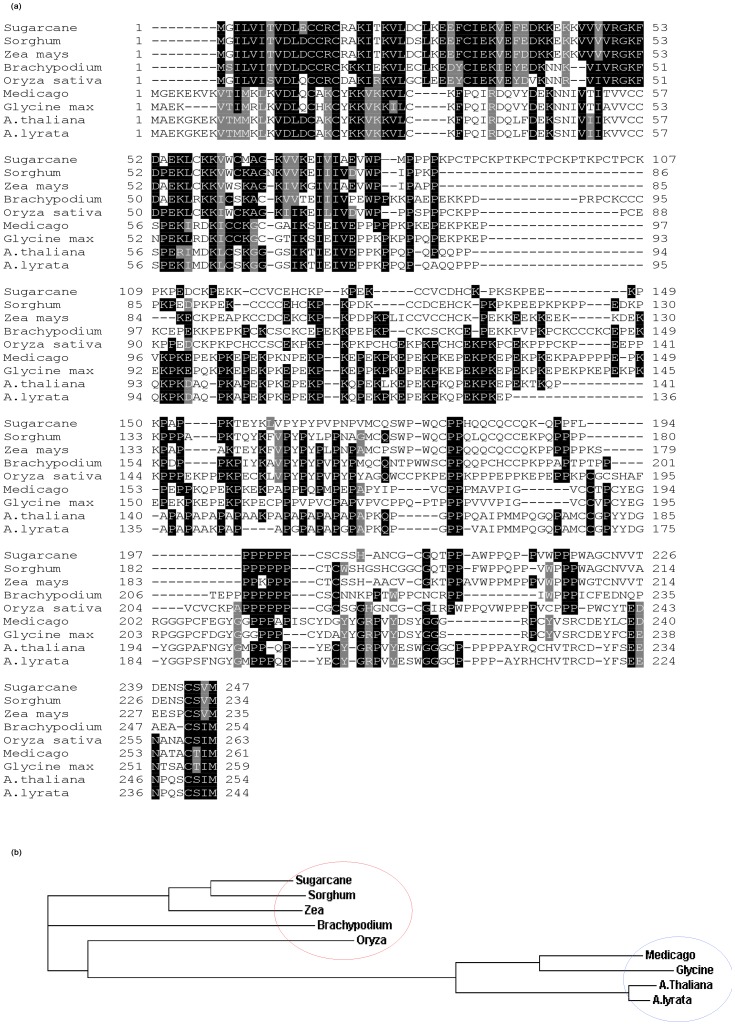
Methodology/principal findings: In a previous study, we evaluated the transcriptome of drought-stressed plants to better understand sugarcane responses to drought. Among the up-regulated genes was Scdr1 (sugarcane drought-responsive 1). The aim of the research reported here was to characterize this gene. Scdr1 encodes a putative protein containing 248 amino acids with a large number of proline (19%) and cysteine (13%) residues. Phylogenetic analysis showed that ScDR1is in a clade with homologs from other monocotyledonous plants, separate from those of dicotyledonous plants. The expression of Scdr1 in different varieties of sugarcane plants has not shown a clear association with drought tolerance.

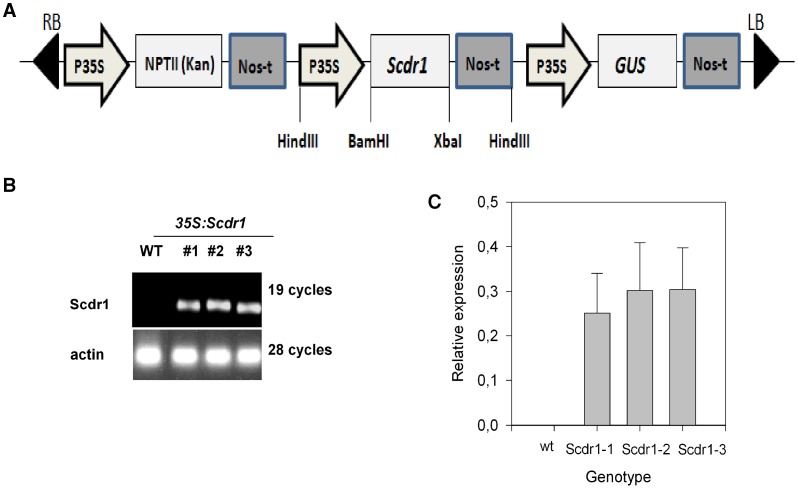
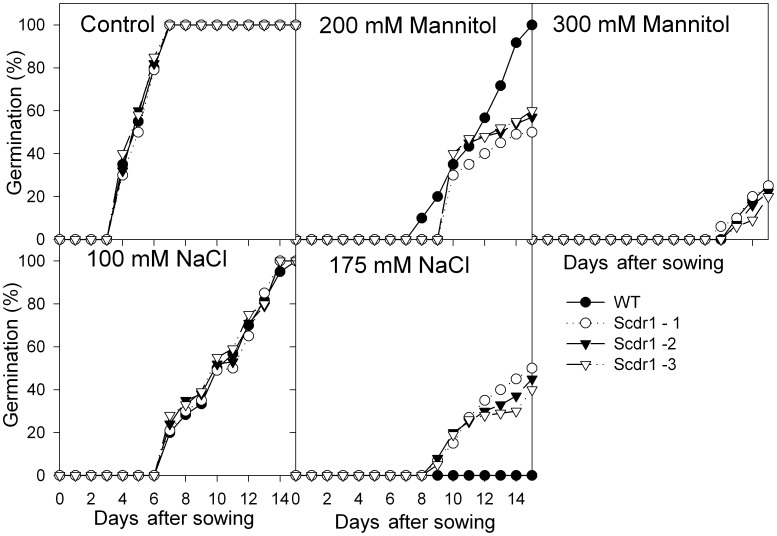
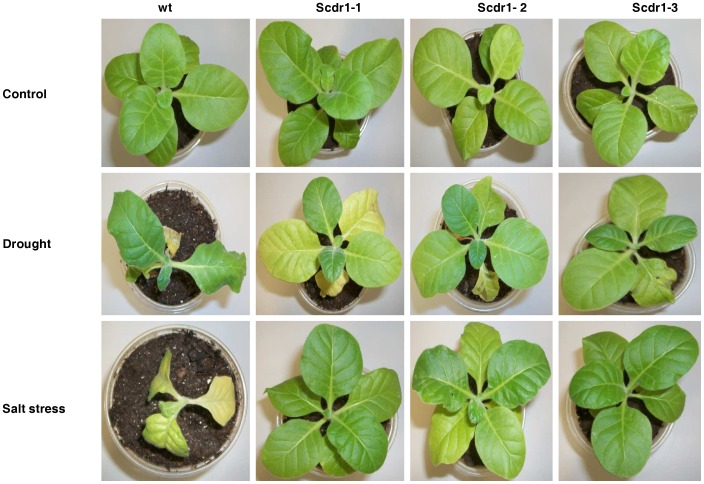
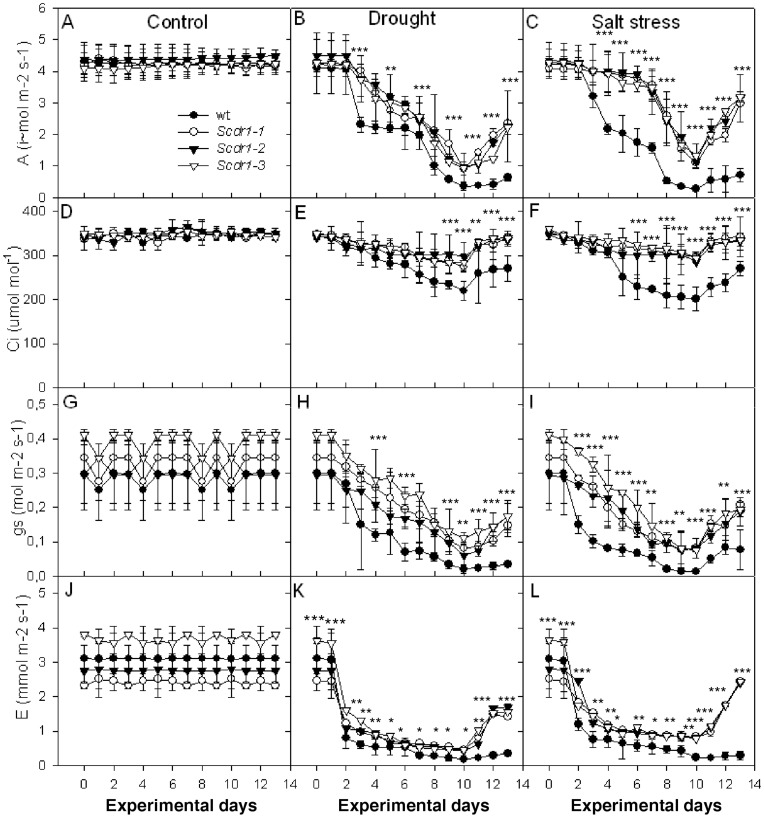
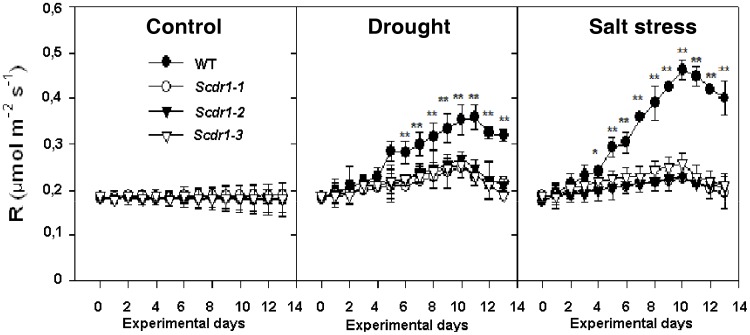
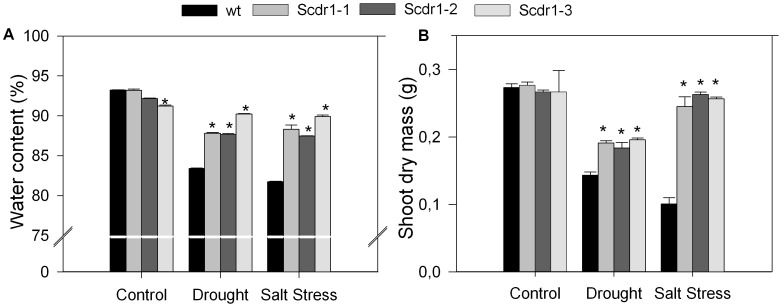
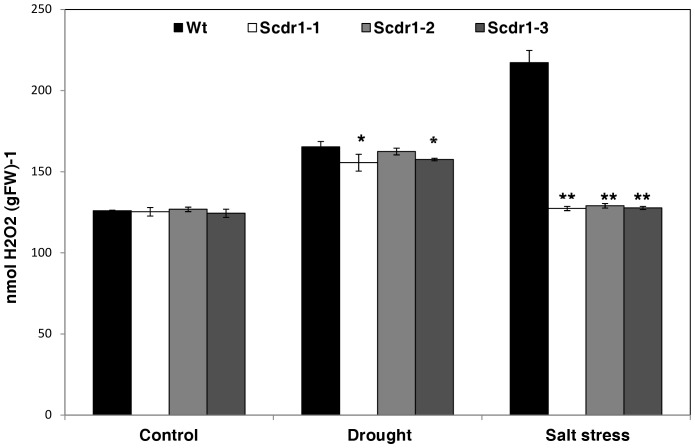
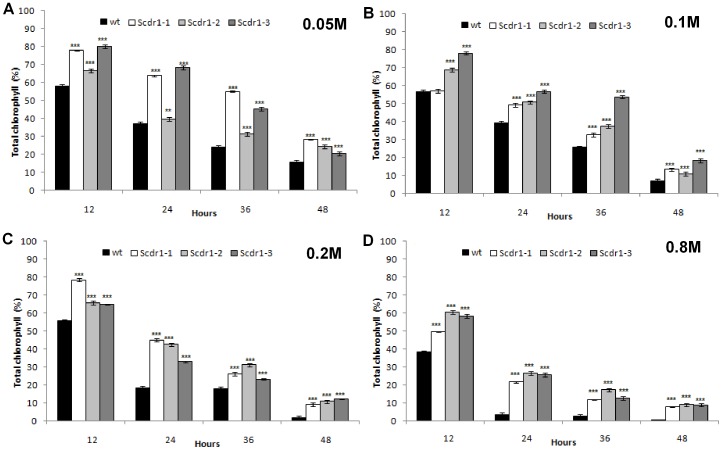
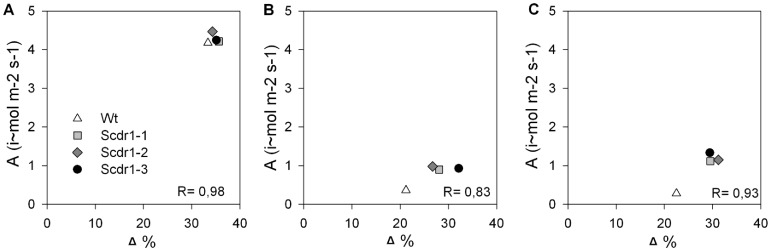
Conclusions/significance: The overexpression of Scdr1 in transgenic tobacco plants increased their tolerance to drought, salinity and oxidative stress, as demonstrated by increased photosynthesis, water content, biomass, germination rate, chlorophyll content and reduced accumulation of ROS. Physiological parameters, such as transpiration rate (E), net photosynthesis (A), stomatal conductance (gs) and internal leaf CO(2) concentration, were less affected by abiotic stresses in transgenic Scdr1 plants compared with wild-type plants. Overall, our results indicated that Scdr1 conferred tolerance to multiple abiotic stresses, highlighting the potential of this gene for biotechnological applications.


Conflict of interest statement

Competing Interests: The authors have declared that no competing interests exist.

Figures

Figure 1
Figure 1. Evaluation of Scdr1 gene expression in drought-stressed sugarcane plants.
Scdr1 gene expression was evaluated in four sugarcane varieties (SP83-5073, SP90-1638, SP83-2847 and SP86-155) after 24, 72 and 120 hours of control or drought stress conditions. The poly-ubiquitin gene was used as a reference gene for normalization. The Scdr1 relative expression was normalized to the control condition. Samples with a statistically significant difference in expression level are indicated with asterisks.
Figure 2
Figure 2. The DNA and deduced protein sequences of Scdr1 (Acc. No JN979786).
The sequence, corresponding to SAS SCSGSB1009D11.g, was obtained from the SUCEST database.
Figure 3
Figure 3. ScDR1 protein sequence analysis.
(A) Alignment of ScDR1 with other homolog proteins; (B) Neighbor-joining tree of sugarcane ScDR1 and its homologs in other monocotyledonous and dicotyledonous plants. All sequences were aligned using the Clustal2W software. Bootstrap values are shown as percentages above each node. Sequence accession numbers: sugarcane (Acc. No JN979786), Sorghum bicolor (XP_002447741.1), Zea mays (ACN37061.1), Brachypodium distachyon (XP_003581156), Oryza sativa (BAG72124.1), Medicago trunculata (ACJ83874.1), Glycine max (AAN03471.1), Arabidopsis thaliana (NP_974559.5), A.lyrata (XP_002870162.1).
Figure 4
Figure 4. Schematic representation of the pCAMBIA2301::Scdr1 construct and PCR confirmation of plant transgene content.
(A) The Scdr1 coding region was cloned between the constitutive CaMV 35S promoter (P35S) and the NOS polyadenylation signal (Nos-t) using pCambia2301 as the backbone. The nptII (kanamycin resistance) gene is also driven by the p35S promoter. LB and RB correspond to the left and right borders of the T-DNA, respectively. The positions of some restriction sites are indicated. (B) Expression of Scdr1 in WT and three T3-generation transgenic lines. Total RNA was extracted from two-week-old seedlings and then analyzed using semi-quantitative RT-PCR. The actin gene was used as an internal standard. (C) Densitometric analysis of the semi-quantitative RT-PCR.
Figure 5
Figure 5. The effects of mannitol and NaCl on seed germination.
The percent germination of transgenic (Scdr1) and WT tobacco seeds at different concentrations of mannitol or NaCl was evaluated over 15 days.
Figure 6
Figure 6. The effects of mannitol and NaCl on tobacco plants.
First row: A WT plant and three transformants overexpressing Scdr1 were grown under control conditions for 13 weeks. Middle row: plants watered with 200 mM mannitol for 10 days and then irrigated with water for 3 days. Bottom row: plants irrigated for 10 days with 175 mM NaCl and then irrigated with water for 3 days.
Figure 7
Figure 7. The effects of stress on gas exchange parameters in WT and Scdr1 transgenic plants.
Thirty-day-old plants were exposed for 10 days to 200 mM mannitol or 175 mM NaCl and then allowed to recover for three days by watering with pure water, as described for figure 7. A–C: Net photosynthesis (A); D–F: Internal leaf CO2 concentration (Ci); G–I: Stomatal conductance (gs); J–K: Transpiration rate (E). A, D, G and J: Control treatment; B, E, H and K: 200 mM mannitol (drought); C, F, I and L: 175 mM NaCl (salt). Asterisks (***, ** and *) indicate significant differences compared with WT plants in each treatment and each time point (P<0.0001, P<0.001 and P<0.01, respectively, n = 5).
Figure 8
Figure 8. Respiration in tobacco leaves exposed to drought and salt stress.
Thirty-day-old WT and transgenic plants were exposed for 10 days to 200 mM mannitol or 175 mM NaCl and were then allowed to recover for three days by watering with pure water. The data shown represent the means of three replicate measurements. Asterisks (** and*) indicate significant differences relative to WT plants in each treatment and each time point (P<0.0001 and P<0.01, respectively, n = 5).
Figure 9
Figure 9. Water content and biomass in WT and Scdr1 transgenic plants.
Thirty-day-old plants were exposed to 200 mM mannitol or 175 mM NaCl for 10 days and then allowed to recover for 3 days by watering with pure water. Control plants were irrigated with water only. The water content in leaves (A) and shoot dry matter (B) were evaluated. Bars represent the means of three independent experiments. Asterisk (*) indicates significant differences compared with WT plants in each treatment (P<0.001, n = 5).
Figure 10
Figure 10. Quantification of hydrogen peroxide in tobacco leaves.
Thirty-day-old plants were exposed for 10 days to 200 mM mannitol or 175 mM NaCl. Control plants were irrigated with water. H2O2 levels in WT and Scdr1 transgenic lines were determined using Fe-Xylenol orange. Data are represented as the mean±standard deviation from three independent experiments (n = 5). Asterisks (** and *) indicate significant differences compared with WT plants in each treatment (P<0.0001 and P<0.001, respectively).
Figure 11
Figure 11. Spectrophotometric quantification of the chlorophyll content in WT and Scdr1 plants exposed to oxidative stress.
Leaf discs (1 mm) from three independent Scdr1 transgenic lines (Scdr1-1, Scdr1-2, Scdr1-3) and non-transgenic control plants were treated with water (control) or with different concentrations of H2O2: A) 0.05 M, B) 0.1 M, C) 0.2 M and D) 0.8 M. The total chlorophyll content in acetone extracts of H2O2-treated leaf discs was evaluated spectrophotometrically. Error bars were calculated from three independent experiments (n = 5). Asterisks (*** and **) indicate significant differences compared with WT plants in each treatment (P<0.0001 and P<0.001 respectively).
Figure 12
Figure 12. The relationship between net photosynthetic rate (A) and carbon isotope discrimination (Δ) in transgenic Scdr1 and WT plants following 10 days of stress.
(A) control, (B) drought, (C) salt stress.

Similar articles

Cited by

References

    1. Lawlor DW, Cornic G (2002) Photosynthetic carbon assimilation and associated metabolism in relation to water deficits in higher plants. Plant Cell Environ 25: 275–294. - PubMed
    1. Boyer JS (1982) Plant productivity and environment. Science 218: 443–448. - PubMed
    1. Maybank J, Bonsal BR, Jones J, Lawford RG, O’Brien EG, et al. (1995) Drought as a natural disaster. Atmosphere-Ocean 33: 195–222.
    1. Zhu JK (2002) Salt and drought stress signal transduction in plants. Annu Rev Plant Biol 53: 247–273. - PMC - PubMed
    1. Solari LI, Johnson S, DeJong TM (2006) Relationship of water status to vegetative growth and leaf gas exchange of peach (Prunus persica) trees on different rootstocks. Tree Physiol 26: 1333–1341. - PubMed

Publication types

MeSH terms