. 2012;7(9):e44748.
doi: 10.1371/journal.pone.0044748. Epub 2012 Sep 11.

Sex differences in carbohydrate metabolism are linked to gene expression in Caenorhabditis elegans

Affiliations

Sex differences in carbohydrate metabolism are linked to gene expression in Caenorhabditis elegans

Claudia Miersch et al. PLoS One. 2012.

Abstract

The male and the hermaphrodite forms of the nematode Caenorhabditis elegans (C. elegans) differ markedly in anatomy, nervous system and behavior at adulthood. Using the male mutants fog-2, him-5, and him-8, we compared body proportions and composition, and aspects of carbohydrate metabolism and gene expression between the C. elegans sexes in three adult stages. In all experiments, both sexes were grown on the same plate and separated using flow cytometry. The fat to fat-free mass ratio and the body volume-adjusted fat mass is similar between the sexes, although the body size is more than 50% smaller in adult males than in age-matched hermaphrodites. The volume-adjusted total RNA content is approximately 2-fold lower in males. Biochemical and NMR-based analyses reveal higher trehalose levels and much lower glucose levels in males than in hermaphrodites. The resulting trehalose-to-glucose ratio is 5.4-fold higher in males. These sex differences are reflected in gene expression data because the genes encoding key enzymes of the glycolysis and trehalose synthesis pathways are more highly expressed in males than in hermaphrodites. Notably, expression of the phosphofructokinase gene (C50F4.2) is 29-fold higher in males. Comparative analysis of gene expression data identifies 285 male-specific and 160 hermaphrodite-specific genes. These include transcription factor and C-type lectin-encoding genes. More than 35% of all C-type lectin genes are more highly expressed in males. The expression of many C-type lectin genes differs by a factor of >100 between the sexes. In conclusion, we found sex differences in carbohydrate metabolism that are linked to gene expression and identified certain lectin genes that are differentially expressed by the C. elegans sexes.


Conflict of interest statement

Competing Interests: The authors have declared that no competing interests exist.

Figures

Figure 1
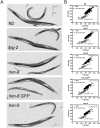
Figure 1. The morphology (A) and flow cytometry-based separation (B) of adult males and hermaphrodites in various C. elegans male mutants.
The mutants were synchronized by hypochlorite treatment of gravid worms and analyzed at one day of adulthood (90 h). (A) Microscopic pictures of wild type (N2) and male mutants. Two independent experiments were performed with 12–24 worms per sex and strain. Scale bar: 100 µm. (B) Flow cytometry displays the time of flight (TOF) and extinction (EXT) values for males and hermaphrodites in the N2 strain and in various mutants. Representative results from two independent experiments with at least 160 worms per strain are shown. Each point represents a single worm. Linear regression lines show differences in TOF and EXT between males and hermaphrodites. The indicated equations correspond to the regression lines.
Figure 2
Figure 2. The relationships between body length and time of flight (TOF, A) and between body volume and extinction (EXT, B).
The data include the different feeding conditions (ad libitum or dietary restriction), both sexes, different strains (N2, fog-2, him-8, him-8 GFP and him-5) and different developmental stages. Each data point represents the mean ± SDs from one experiment. In each experiment, at least 10 and 140 worms were analyzed via microscopy and flow cytometry, respectively. The linear regression equations, p and r2 values were calculated.
Figure 3
Figure 3. The flow cytometry-based parameters measuring the body proportions of him-8 GFP males and hermaphrodites at various developmental stages.
The time of flight (TOF, A) and extinction (EXT, B) values of him-8 GFP worms were assessed via flow cytometry at various developmental stages from egg [0 h] to adult [96 h]. The him-8 GFP males and hermaphrodites could be separated once they reached the young adult stage (approximately 64 h) based on the GFP signal. The relative differences between males and hermaphrodites are given at 96 h. The results from three independent experiments are presented as the mean ± SDs. At least 140 worms per sex and time point were used in each experiment.
Figure 4
Figure 4. The body length (A) and body volume (B) of adult males and hermaphrodites in various C. elegans male mutants.
The mutants were synchronized by hypochlorite treatment of gravid worms and analyzed at one day of adulthood (90 h). Microscopic images from each mutant strain were used to determine the body length and body volume of males and hermaphrodites. The values are expressed as the mean ± SDs and include two independent experiments. Between 12–24 worms per sex and strain were scored in each experiment. The bars with different letters represent significantly different results between strains (p<0.05). To determine significant differences, a one-way ANOVA was performed and followed by a post hoc test (the Bonferroni multiple comparison test or Dunnett’s T3 test, when inhomogeneity of variance was evident).
Figure 5
Figure 5. The body composition of males and hermaphrodites at various developmental stages.
The triglyceride content (A), protein content (B) and the resulting triglyceride-to-protein ratio (C) of him-8 GFP males and hermaphrodites at young adulthood (66 h), adulthood (76 h) and one day of adulthood (90 h). Male body composition parameters were normalized to the body volume so that they were comparable to the results for the hermaphrodites (A, B). Comparison of the triglyceride-to-protein ratio for the fog-2, him-8, him-8 GFP and him-5 mutants at adulthood (90 h, D). The results of N2 hermaphrodites were used as a reference and included as a dashed line (D). Data represent the mean ± SDs from 3–8 independent experiments. Significant differences between males and hermaphrodites are indicated using asterisks (* p<0.05, ** p<0.01, *** p<0.001, t-test).
Figure 6
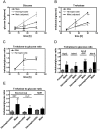
Figure 6. The trehalose and glucose content of males and hermaphrodites at various developmental stages.
The glucose content (A), trehalose content (B) and resulting trehalose-to-glucose ratio (C) of him-8 GFP males and hermaphrodites at young adulthood (66 h), adulthood (76 h) and one day of adulthood (90 h) are shown. The male glucose and trehalose content was adjusted to the body volume so that it was comparable to the results for the hermaphrodites (A, B). Comparison of the trehalose-to-glucose ratio in the fog-2, him-8, him-8 GFP and him-5 mutants at adulthood (90 h, D). The results of N2 hermaphrodites were used as a reference and included as a dashed line (D). The trehalose and glucose levels were validated using NMR spectroscopy (E). The trehalose-to-glucose ratio from biochemical assays (using NET buffer or distilled water as solvent) and NMR spectroscopy experiments are presented. The data represent the mean ± SDs from 3–8 independent experiments. Significant differences between males and hermaphrodites are indicated using asterisks (* p<0.05, ** p<0.01, *** p<0.001, t-test).
Figure 7
Figure 7. The total RNA content of young adult and adult him-8 GFP males and hermaphrodites.
Total RNA was isolated from young adult (66 h) and adult (76 h) him-8 GFP males and hermaphrodites. The RNA content of males was adjusted to body volume so that the results were comparable to those of hermaphrodites. The data represent the mean ± SDs, n = 3. Significant differences between the male or male (adjusted) and the hermaphrodite were determined using a t-test (**p<0.01, ***p<0.001).
Figure 8
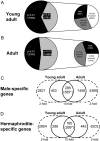
Figure 8. The number of differentially expressed genes between the him-8 GFP males and hermaphrodites.
The pie charts (A, B) show the number of differentially expressed genes between the him-8 GFP males and hermaphrodites at the young adult (66 h, A) and adult (76 h, B) stages. Genes that were expressed 2-fold or more higher in the corresponding sex were considered as male-enriched (black) or hermaphrodite-enriched (grey) genes. The number of genes is listed within the brackets. The Venn diagrams (C, D) display the overlap of male- (C) or hermaphrodite- (C) specific genes at the young adult (66 h) and adult (76 h) stages. To scale down the number of genes, the cut-off was increased from 2-fold (dashed cycles) to 10-fold (solid circles). * Genes in the other sex that were expressed at levels that was higher than 100 were excluded.
Figure 9
Figure 9. The differential expression of C-type lectin genes between him-8 GFP males and hermaphrodites at the young adulthood (66 h) and adulthood (76 h) stages.
The differential expression level of each C-type lectin gene between him-8 GFP males and hermaphrodites is indicated using color. For red (blue), the expression level is at least 2-fold higher (p<0.05) in hermaphrodites (males) than in males (hermaphrodites). For items marked in grey, there is no difference in the expression level between both sexes. Each row shows one C-type lectin gene from clec-1 (top) to clec-266 (bottom).
Figure 10
Figure 10. The conversion of glucose in males and hermaphrodites.
Glucose can be catabolized to pyruvate in glycolysis converted to trehalose or synthesized to glycogen. How pronounced each pathway is in each sex is indicated by the thickness of the arrows. Asterisks indicate significantly regulated genes.

Similar articles

Cited by

References

    1. Hodgkin J, Horvitz HR, Brenner S (1979) Nondisjunction Mutants of the Nematode CAENORHABDITIS ELEGANS. Genetics 91: 67–94. - PMC - PubMed
    1. LaMunyon CW, Ward S (1998) Larger sperm outcompete smaller sperm in the nematode Caenorhabditis elegans. Proc Biol Sci 265: 1997–2002. - PMC - PubMed
    1. Ward S, Carrel JS (1979) Fertilization and sperm competition in the nematode Caenorhabditis elegans. Dev Biol 73: 304–321. - PubMed
    1. Sulston JE, Albertson DG, Thomson JN (1980) The Caenorhabditis elegans male: postembryonic development of nongonadal structures. Dev Biol 78: 542–576. - PubMed
    1. Sulston JE, Horvitz HR (1977) Post-embryonic cell lineages of the nematode, Caenorhabditis elegans. Dev Biol 56: 110–156. - PubMed

Publication types