. 2012;7(9):e44800.
doi: 10.1371/journal.pone.0044800. Epub 2012 Sep 11.

Mining gene expression signature for the detection of pre-malignant melanocytes and early melanomas with risk for metastasis

Affiliations

Mining gene expression signature for the detection of pre-malignant melanocytes and early melanomas with risk for metastasis

Camila Ferreira de Souza et al. PLoS One. 2012.

Abstract

Background: Metastatic melanoma is a highly aggressive skin cancer and currently resistant to systemic therapy. Melanomas may involve genetic, epigenetic and metabolic abnormalities. Evidence is emerging that epigenetic changes might play a significant role in tumor cell plasticity and metastatic phenotype of melanoma cells.

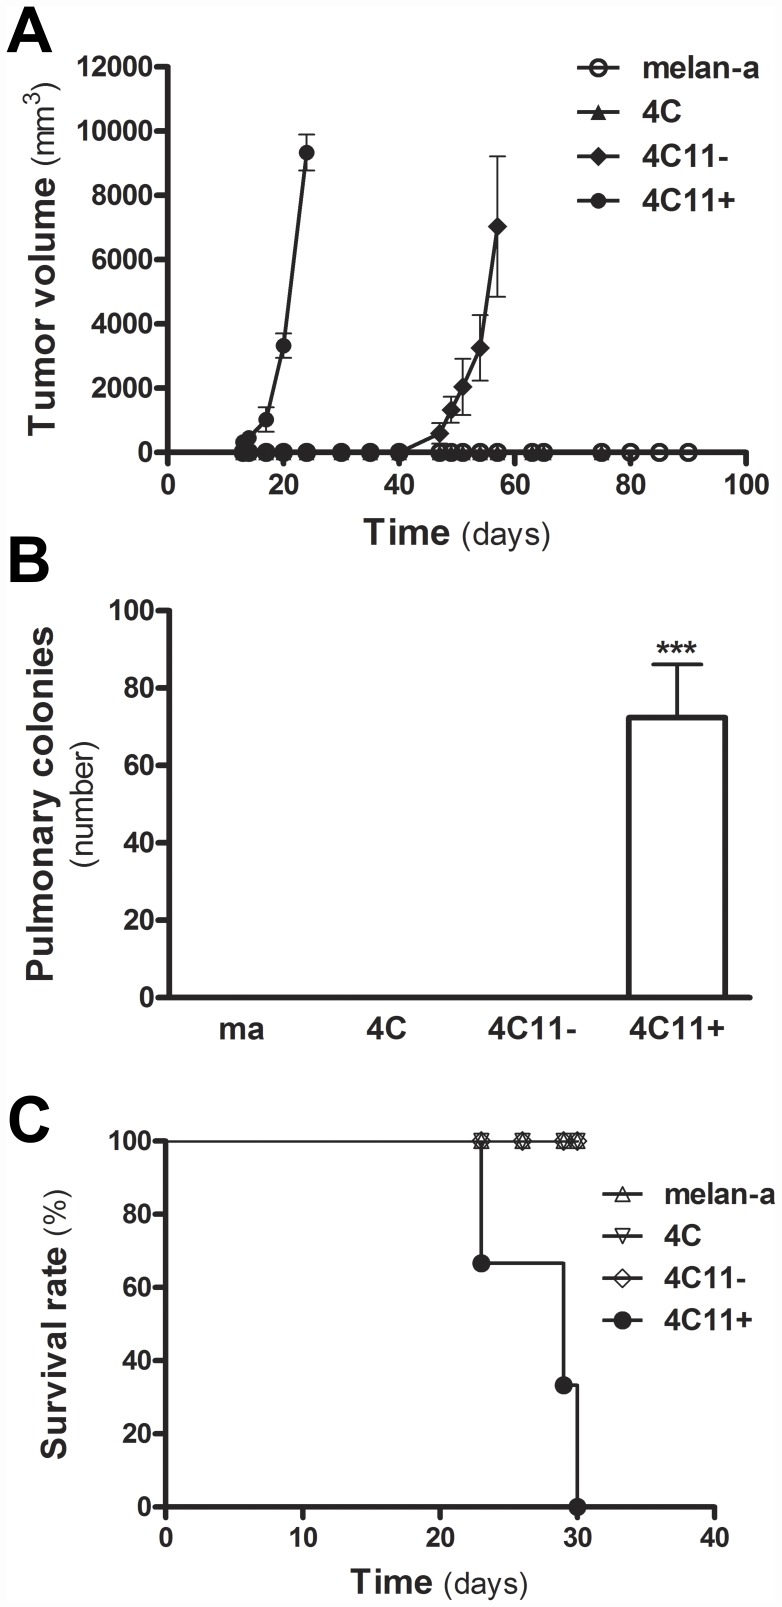
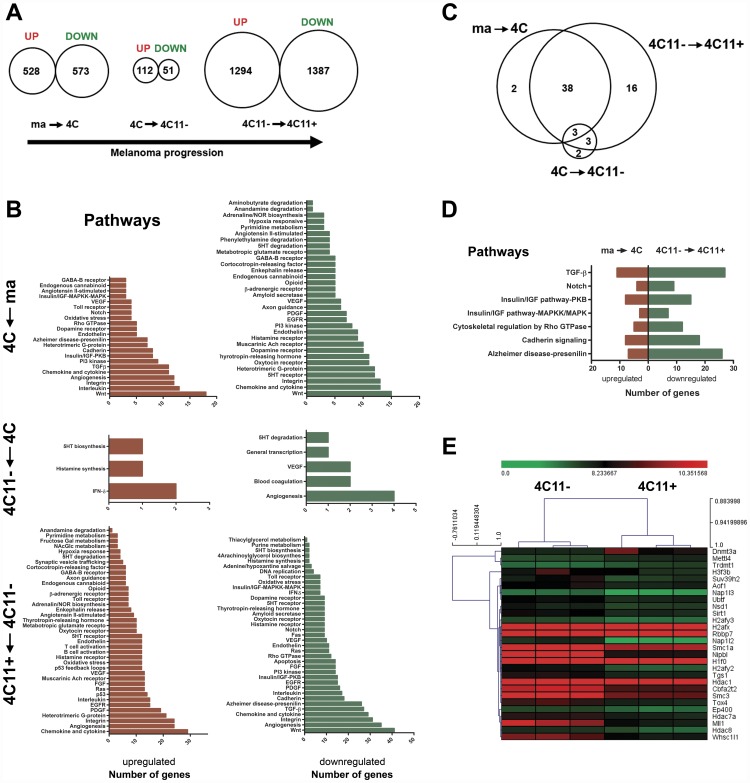
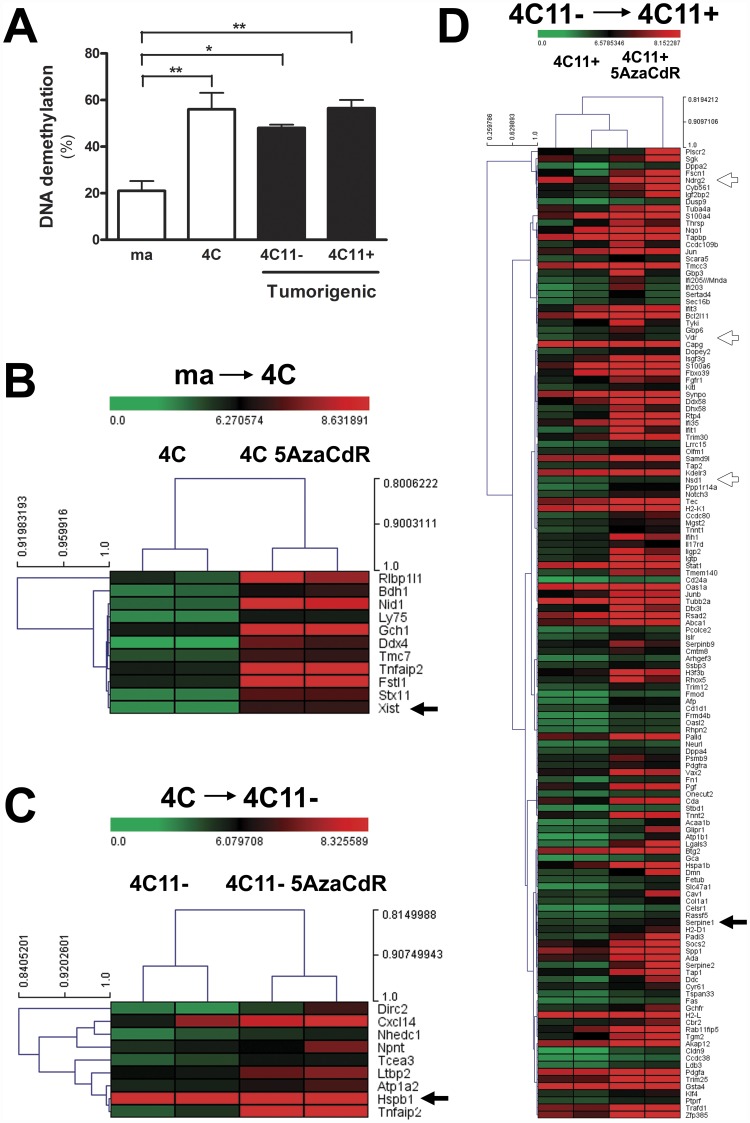
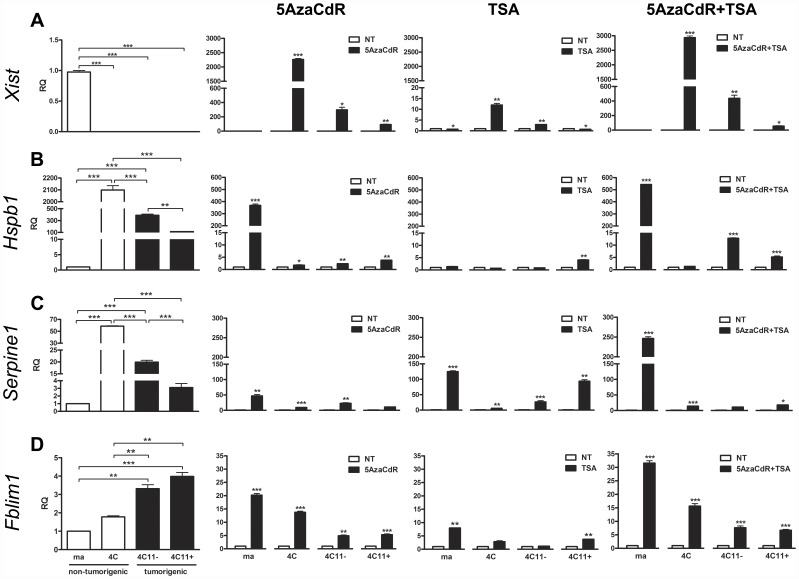
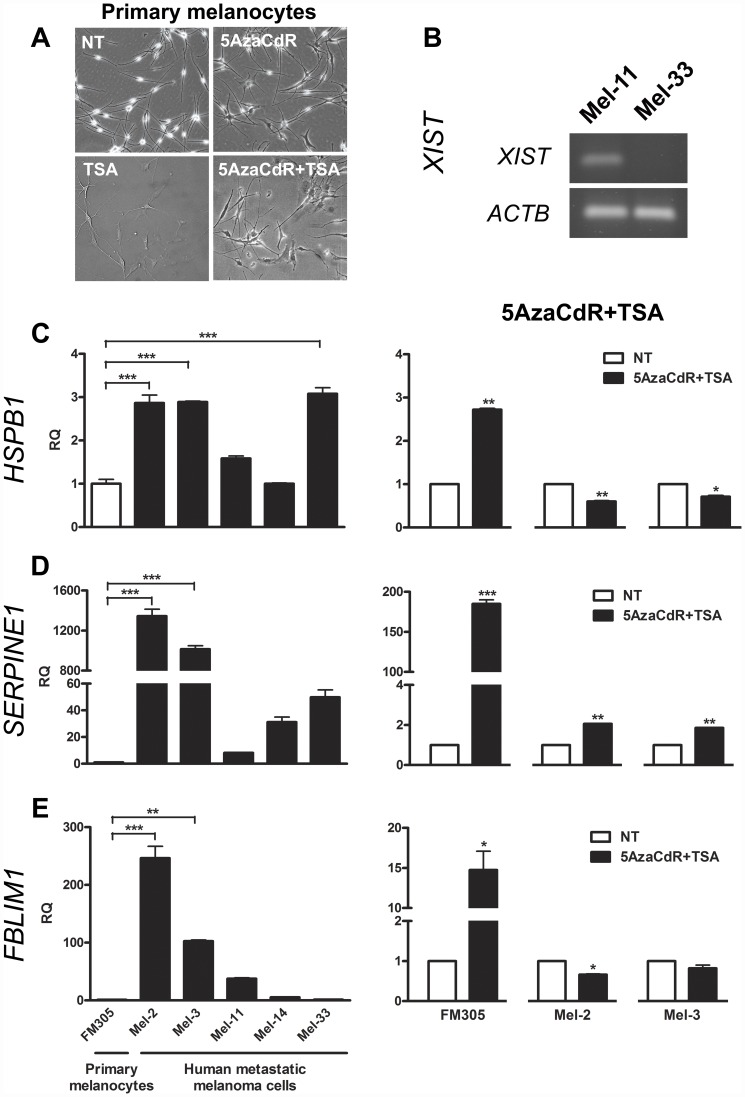
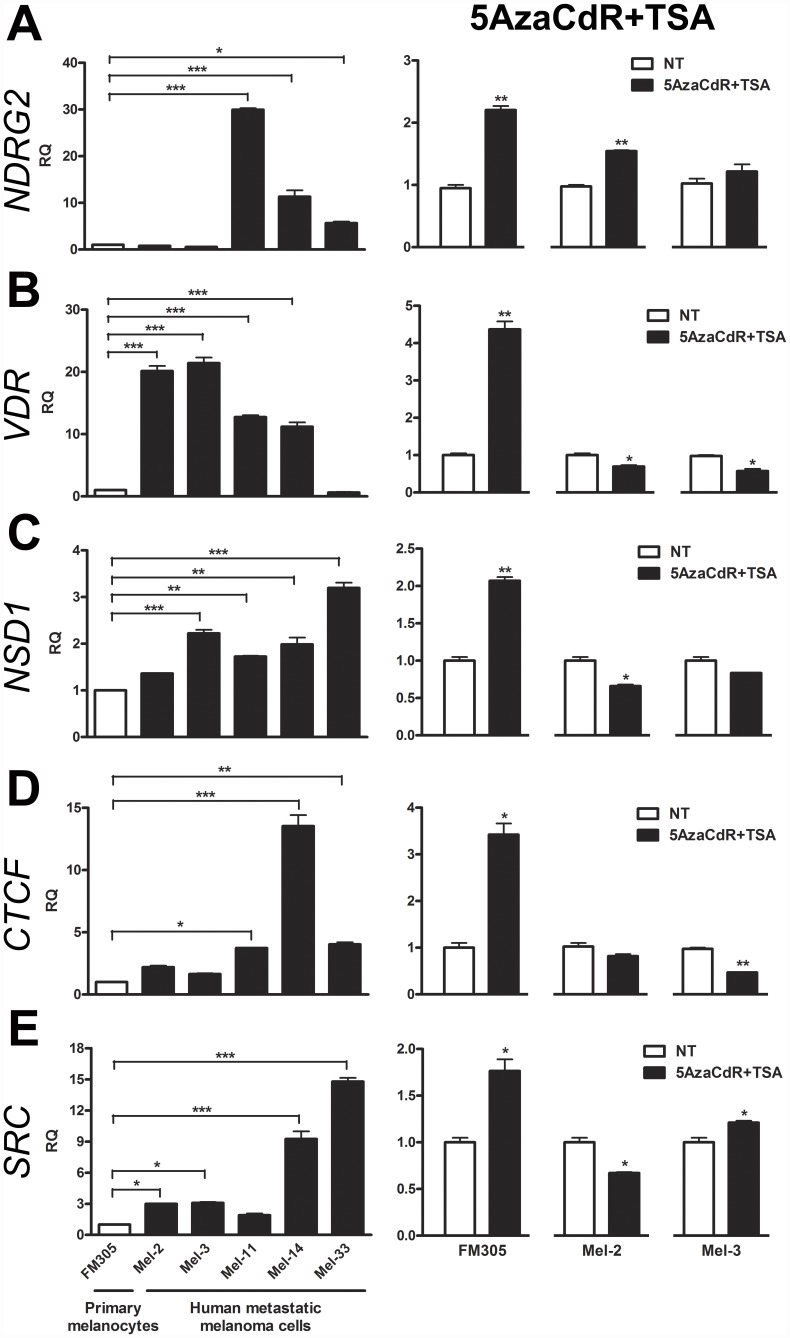
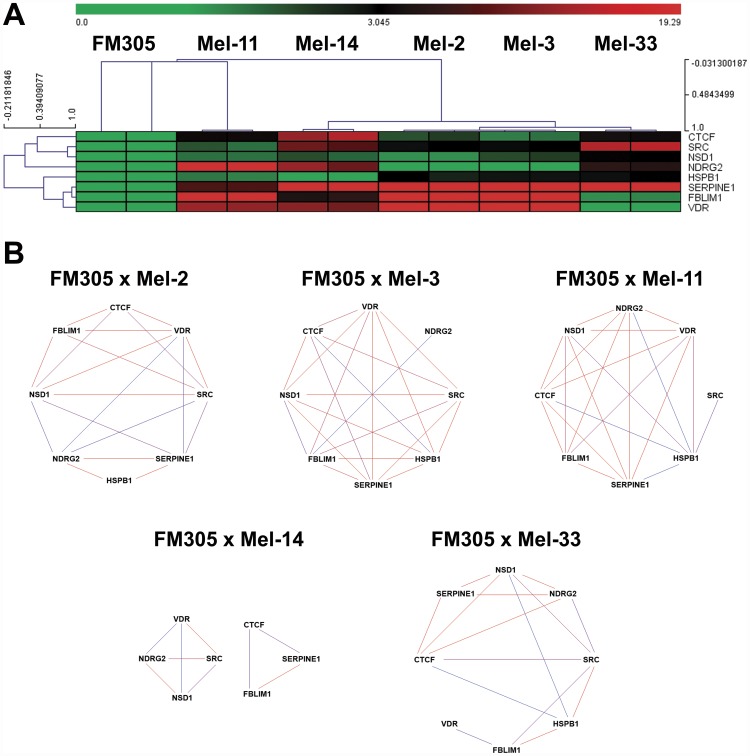
Principal findings: In this study, we developed a systematic approach to identify genes implicated in melanoma progression. To do this, we used the Affymetrix GeneChip Arrays to screen 34,000 mouse transcripts in melan-a melanocytes, 4C pre-malignant melanocytes, 4C11- non-metastatic and 4C11+ metastatic melanoma cell lines. The genome-wide association studies revealed pathways commonly over-represented in the transition from immortalized to pre-malignant stage, and under-represented in the transition from non-metastatic to metastatic stage. Additionally, the treatment of cells with 10 µM 5-aza-2'-deoxycytidine (5AzaCdR) for 48 hours allowed us to identify genes differentially re-expressed at specific stages of melan-a malignant transformation. Treatment of human primary melanocytes with the demethylating agent 5AzaCdR in combination to the histone deacetylase inhibitor Trichostatin A (TSA) revealed changes on melanocyte morphology and gene expression which could be an indicator of epigenetic flexibility in normal melanocytes. Moreover, changes on gene expression recognized by affecting the melanocyte biology (NDRG2 and VDR), phenotype of metastatic melanoma cells (HSPB1 and SERPINE1) and response to cancer therapy (CTCF, NSD1 and SRC) were found when Mel-2 and/or Mel-3-derived patient metastases were exposed to 5AzaCdR plus TSA treatment. Hierarchical clustering and network analyses in a panel of five patient-derived metastatic melanoma cells showed gene interactions that have never been described in melanomas.

Significance: Despite the heterogeneity observed in melanomas, this study demonstrates the utility of our murine melanoma progression model to identify molecular markers commonly perturbed in metastasis. Additionally, the novel gene expression signature identified here may be useful in the future into a model more closely related to translational research.


Conflict of interest statement

Competing Interests: The authors have declared that no competing interests exist.

Figures

Figure 1
Figure 1. Tumorigenicity and Metastatic Capabilities Were Acquired by melan-a Melanocytes after Detachment/Re-adhesion Cycles.
(A) Tumorigenicity assay in vivo. Mice were subcutaneously injected with melan-a melanocyte lineage and its derived cell lines 4C, 4C11− and 4C11+ (2.5x10⁵ cells per mouse). Tumor volume was measured during 100 days (n = 5 animals for each group, P<0.01 by One-Way ANOVA test for significance). (B) Metastasis capacity in vivo. Lungs of mice were analyzed after tail vein injection of 4C11− and 4C11+ melanoma cell lines (2.5x10⁵ cells per mouse). Melan-a and 4C non-tumorigenic melanocyte lineages were used as negative controls. Tumor multiplicity is indicated by the number of lung tumor nodules formed by 4C11+ melanoma cell line (n = 5 animals for each group, P<0.0001 by One-Way ANOVA test for significance). (C) Survival curves of mice injected intravenously with 4C11− and 4C11+ melanoma cell lines (2.5x10⁵ cells per mouse) (n = 5 animals for each group, P<0.0001 by Log-rank test for significance). Poor clinical outcomes were observed for all animals injected with 4C11+ metastatic melanoma cell line.
Figure 2
Figure 2. Pre-Malignant Melanocytes and Metastatic Melanomas Shared Deregulated Pathways.
(A) Gene expression profiles of melan-a, 4C, 4C11– and 4C11+ cell lines revealed differentially up- and down-regulated genes in the transitions associated with malignant transformation of melan-a melanocytes (from melan-a to 4C, 4C to 4C11−, and 4C11− to 4C11+ cells). Transcripts were selected as statistically significant by the unpairwise two-class SAM analysis (FDR and Q-values<0.05). (B) PANTHER software was used to determine pathway profiles deregulated in the course of melanoma progression. (C) Venn diagram pointed out pathways deregulated at specific stages of melan-a malignant transformation. (D) Identification of pathways commonly over-represented in 4C pre-malignant melanocytes in relation to melan-a cells, and under-represented in 4C11+ metastatic melanoma cell line in relation to 4C11− non-metastatic melanoma cells. (E) Epigenetic signature as a candidate marker associated with the transition from non-metastatic to metastatic phenotype. ma: immortalized, but non-tumorigenic, melan-a melanocyte lineage; 4C: pre-malignant melanocyte lineage; 4C11−: non-metastatic melanoma cell line, and 4C11+: metastatic melanoma cell line.
Figure 3
Figure 3. Demethylating Agent 5-aza-2′-deoxycytidine Differentially Modulated Gene Expression at Specific Stages of Melanoma Progression.
(A) The 4C pre-malignant melanocytes, 4C11− non-metastatic and 4C11+ metastatic melanoma cell lines displayed the same percent of global genomic DNA demethylation upon 5AzaCdR treatment. (B-D) Genome-wide association studies of melan-a, 4C, 4C11− and 4C11+ cell lines untreated and previously exposed to 5AzaCdR revealed re-expressed genes at a given transition associated with melan-a malignant transformation. Heatmaps were generated by unsupervised hierarchical clustering using the Pearson correlation as metric distance and average-linkage as algorithm as well. The saturation of either color (scale from green to red) reflects the magnitude of the difference on gene expression level. ma: immortalized, but non-tumorigenic, melan-a melanocyte lineage; 4C: pre-malignant melanocyte lineage; 4C11−: non-metastatic melanoma cell line, and 4C11+: metastatic melanoma cell line. 5AzaCdR: 5-aza-2′-deoxycytidine.
Figure 4
Figure 4. Candidate Markers for melan-a Malignant Transformation.
(A) Xist, (B) Hspb1, (C) Serpine1 and (D) Fblim1 genes were assessed for relative quantification (RQ) in mouse cell lines across the melanoma progression spectrum (melan-a, 4C, 4C11− and 4C11+) non-treated (NT) or previously treated with 40 nM TSA for 16 hours, 10 µM 5AzaCdR for 48 hours, and 10 µM 5AzaCdR for 48 hours plus 40 nM TSA for 16 hours. Relative gene expression was calculated according to 2-ΔΔCq method, using cellular Actb mRNA levels as endogenous reference control. Error bars in all cases represent SEM and P values were based on Students' t test or One-Way ANOVA test followed by the post-hoc Tukey. *P<0.05, **P<0.01, ***P<0.001. ma: immortalized, but non-tumorigenic, melan-a melanocyte lineage; 4C: pre-malignant melanocyte lineage; 4C11−: non-metastatic melanoma cell line, and 4C11+: metastatic melanoma cell line. TSA: Trichostatin A; 5AzaCdR: 5-aza-2′-deoxycytidine.
Figure 5
Figure 5. Epigenetic Flexibility in Human Specimens.
(A) Changes on cell morphology of human primary melanocytes after their exposure to epigenetic modifier drugs, specially the combined therapy between 5AzaCdR and TSA. (B) Differential expression of XIST gene between two female patient-derived metastatic melanoma cell lines. (C-E) Expression of genes HSPB1, SERPINE1 and FBLIM1 was modulated in response to epigenetic compounds in human primary melanocytes and metastatic melanoma cells. Differential expression in a panel of five early-passage patient-derived metastases was also determined by RT-qPCR. Relative gene expression was calculated according to 2-ΔΔCq method, using cellular ACTB mRNA levels as endogenous reference control. Error bars in all cases represent SEM and P values were based on Students' t test or One-Way ANOVA test followed by the post-hoc Tukey. *P<0.05, **P<0.01, ***P<0.001. FM305: human primary melanocytes from neonatal foreskin; Mel-2: right supraclavicular lymph node metastasis; Mel-3: counterpart of Mel-2 after the re-occurrence of the disease; Mel-11: brain metastasis; Mel-14: axillary lymph node metastasis, and Mel-33: inguinal lymph node metastasis. TSA: Trichostatin A; 5AzaCdR: 5-aza-2′-deoxycytidine.
Figure 6
Figure 6. Epigenetic Drugs Modulated the Expression of Genes Recognized by Affecting Melanocyte Biology and Response to Therapy.
Expression of genes recognized by affecting (A-B) melanocyte biology, and (C-E) response to cancer therapy was deregulated in a panel of five patient-derived metastatic melanoma cell lines in comparison to FM305 primary melanocytes, as assessed by RT-qPCR approach. (A-E) Epigenetic compounds 5AzaCdR and TSA modulated the expression of genes NDRG2, VDR, NSD1, CTCF and SRC in normal melanocytes and metastatic melanoma cells. Relative gene expression and Statistics were calculated as described in figure 5. FM305: human primary melanocytes from neonatal foreskin; Mel-2: right supraclavicular lymph node metastasis; Mel-3: counterpart of Mel-2 after the re-occurrence of the disease; Mel-11: brain metastasis; Mel-14: axillary lymph node metastasis, and Mel-33: inguinal lymph node metastasis. TSA: Trichostatin A; 5AzaCdR: 5-aza-2′-deoxycytidine.
Figure 7
Figure 7. Hierarchical Clustering and Network Analyses Revealed Novel Gene Interactions in Melanoma Progression.
(A) Heatmap of five patient-derived metastatic melanoma cell lines. Metastases of human melanoma cell lines were clustered according to the expression profiles of genes CTCF, FBLIM1, HSPB1, NDRG2, NSD1, SERPINE1, SRC and VDR. Heatmaps were generated by unsupervised hierarchical clustering using the Pearson correlation as metric distance and average-linkage as algorithm as well. The saturation of either color (scale from green to red) reflects the magnitude of the difference on gene expression level. (B) Despite the molecular heterogenety observed in melanoma cells, relevance networks pointed out gene interactions commonly observed among the metastases examined, such as NDRG2/NSD1, VDR/NSD1, SRC/NSD1, CTCF/SERPINE1, HSPB1/SERPINE1 and FBLIM1/SERPINE1. FM305: human primary melanocytes from neonatal foreskin; Mel-2: right supraclavicular lymph node metastasis; Mel-3: counterpart of Mel-2 after the re-occurrence of the disease; Mel-11: brain metastasis; Mel-14: axillary lymph node metastasis, and Mel-33: inguinal lymph node metastasis.

Similar articles

Cited by

References

    1. Soengas MS, Lowe SW (2003) Apoptosis and melanoma chemoresistance. Oncogene 22: 3138–3151. - PubMed
    1. Balch CM, Gershenwald JE, Soong SJ, Thompson JF, Atkins MB, et al. (2009) Final version of 2009 AJCC melanoma staging and classification. J Clin Oncol 27: 6199–6206. - PMC - PubMed
    1. Vidwans SJ, Flaherty KT, Fisher DE, Tenenbaum JM, Travers MD, et al. (2011) A melanoma molecular disease model. PLoS One 6: e18257. - PMC - PubMed
    1. Souza CF, Morais AS, Jasiulionis MG (2012) Biomarkers as key contributors in treating malignant melanoma metastases. Dermatol Res Pract 156068. - PMC - PubMed
    1. Hoek KS, Goding CR (2010) Cancer stem cells versus phenotype-switching in melanoma. Pigment Cell Melanoma Res 23: 746–759. - PubMed

Publication types

MeSH terms