

Peripheral blood gene expression as a novel genomic biomarker in complicated sarcoidosis
- PMID: 22984568
- PMCID: PMC3440319
- DOI: 10.1371/journal.pone.0044818
Peripheral blood gene expression as a novel genomic biomarker in complicated sarcoidosis
Abstract
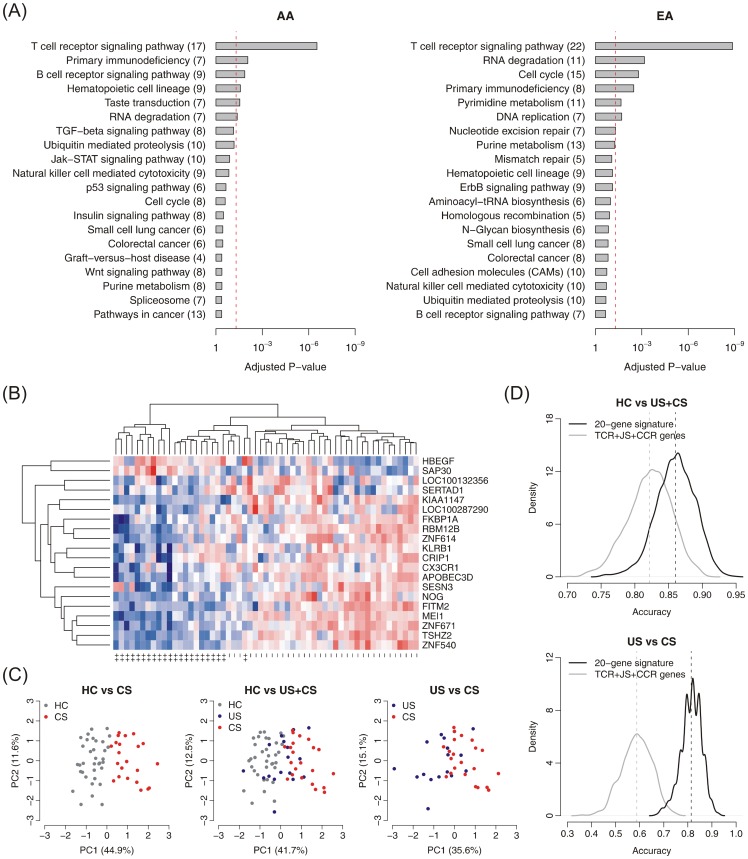
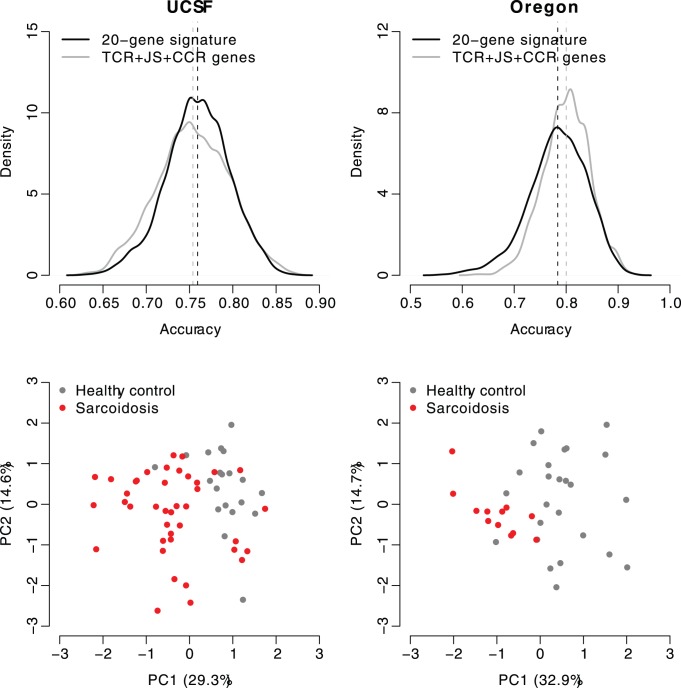
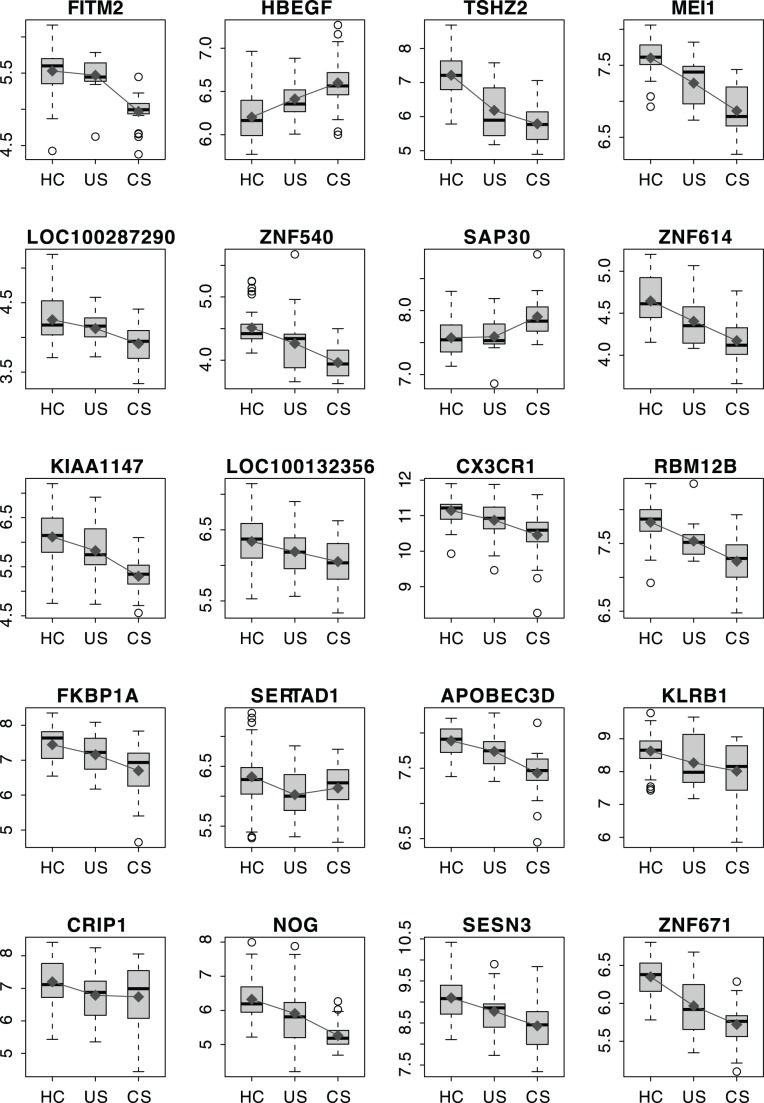
Sarcoidosis, a systemic granulomatous syndrome invariably affecting the lung, typically spontaneously remits but in ~20% of cases progresses with severe lung dysfunction or cardiac and neurologic involvement (complicated sarcoidosis). Unfortunately, current biomarkers fail to distinguish patients with remitting (uncomplicated) sarcoidosis from other fibrotic lung disorders, and fail to identify individuals at risk for complicated sarcoidosis. We utilized genome-wide peripheral blood gene expression analysis to identify a 20-gene sarcoidosis biomarker signature distinguishing sarcoidosis (n = 39) from healthy controls (n = 35, 86% classification accuracy) and which served as a molecular signature for complicated sarcoidosis (n = 17). As aberrancies in T cell receptor (TCR) signaling, JAK-STAT (JS) signaling, and cytokine-cytokine receptor (CCR) signaling are implicated in sarcoidosis pathogenesis, a 31-gene signature comprised of T cell signaling pathway genes associated with sarcoidosis (TCR/JS/CCR) was compared to the unbiased 20-gene biomarker signature but proved inferior in prediction accuracy in distinguishing complicated from uncomplicated sarcoidosis. Additional validation strategies included significant association of single nucleotide polymorphisms (SNPs) in signature genes with sarcoidosis susceptibility and severity (unbiased signature genes - CX3CR1, FKBP1A, NOG, RBM12B, SENS3, TSHZ2; T cell/JAK-STAT pathway genes such as AKT3, CBLB, DLG1, IFNG, IL2RA, IL7R, ITK, JUN, MALT1, NFATC2, PLCG1, SPRED1). In summary, this validated peripheral blood molecular gene signature appears to be a valuable biomarker in identifying cases with sarcoidoisis and predicting risk for complicated sarcoidosis.
Conflict of interest statement
Figures
References
-
- Iannuzzi MC, Rybicki BA, Teirstein AS (2007) Sarcoidosis. N Engl J Med 357: 2153–2165. - PubMed
-
- Newman LS, Rose CS, Maier LA (1997) Sarcoidosis. N Engl J Med 336: 1224–1234. - PubMed
-
- Nunes H, Freynet O, Naggara N, Soussan M, Weinman P, et al. (2010) Cardiac sarcoidosis. Semin Respir Crit Care Med 31: 428–441. - PubMed
-
- Zajicek JP, Scolding NJ, Foster O, Rovaris M, Evanson J, et al. (1999) Central nervous system sarcoidosis–diagnosis and management. Qjm 92: 103–117. - PubMed
-
- Morgenthau AS, Iannuzzi MC (2011) Recent advances in sarcoidosis. Chest 139: 174–182. - PubMed
Publication types
MeSH terms
Substances
Grants and funding
LinkOut - more resources
Full Text Sources
Other Literature Sources
Medical
Molecular Biology Databases
Research Materials
Miscellaneous
