PET imaging of lung inflammation with [18F]FEDAC, a radioligand for translocator protein (18 kDa)
- PMID: 22984611
- PMCID: PMC3440397
- DOI: 10.1371/journal.pone.0045065
PET imaging of lung inflammation with [18F]FEDAC, a radioligand for translocator protein (18 kDa)
Abstract
Purpose: The translocator protein (18 kDa) (TSPO) is highly expressed on the bronchial and bronchiole epithelium, submucosal glands in intrapulmonary bronchi, pneumocytes and alveolar macrophages in human lung. This study aimed to perform positron emission tomography (PET) imaging of lung inflammation with [(18)F]FEDAC, a specific TSPO radioligand, and to determine cellular sources enriching TSPO expression in the lung.
Methods: An acute lung injury model was prepared by intratracheal administration of lipopolysaccharide (LPS) to rat. Uptake of radioactivity in the rat lungs was measured with small-animal PET after injection of [(18)F]FEDAC. Presence of TSPO was examined in the lung tissue using Western blot and immunohistochemical assays.
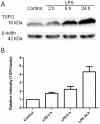
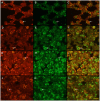
Results: The uptake of [(18)F]FEDAC increased in the lung with the progress of inflammation by treatment with LPS. Pretreatment with a TSPO-selective ligand PK11195 showed a significant decrease in the lung uptake of [(18)F]FEDAC due to competitive binding to TSPO. TSPO expression was elevated in the inflamed lung section and its level responded to the [(18)F]FEDAC uptake and severity of inflammation. Increase of TSPO expression was mainly found in the neutrophils and macrophages of inflamed lungs.
Conclusion: From this study we conclude that PET with [(18)F]FEDAC may be a useful tool for imaging TSPO expression and evaluating progress of lung inflammation. Study on human lung using [(18)F]FEDAC-PET is promising.
Conflict of interest statement
Figures


Similar articles
-
Visualization of acute liver damage induced by cycloheximide in rats using PET with [(18)F]FEDAC, a radiotracer for translocator protein (18 kDa).PLoS One. 2014 Jan 23;9(1):e86625. doi: 10.1371/journal.pone.0086625. eCollection 2014. PLoS One. 2014. PMID: 24466178 Free PMC article.
-
In vivo imaging and quantitative analysis of TSPO in rat peripheral tissues using small-animal PET with [18F]FEDAC.Nucl Med Biol. 2010 Oct;37(7):853-60. doi: 10.1016/j.nucmedbio.2010.04.183. Nucl Med Biol. 2010. PMID: 20870161
-
Utility of Translocator Protein (18 kDa) as a Molecular Imaging Biomarker to Monitor the Progression of Liver Fibrosis.Sci Rep. 2015 Nov 27;5:17327. doi: 10.1038/srep17327. Sci Rep. 2015. PMID: 26612465 Free PMC article.
-
Preclinical Evaluation of TSPO and MAO-B PET Radiotracers in an LPS Model of Neuroinflammation.PET Clin. 2021 Apr;16(2):233-247. doi: 10.1016/j.cpet.2020.12.003. PET Clin. 2021. PMID: 33648665 Review.
-
Mapping of Translocator Protein (18 kDa) in Peripheral Sterile Inflammatory Disease and Cancer through PET Imaging.Mol Pharm. 2021 Apr 5;18(4):1507-1529. doi: 10.1021/acs.molpharmaceut.1c00002. Epub 2021 Mar 1. Mol Pharm. 2021. PMID: 33645995 Review.
Cited by
-
Molecular imaging of folate receptor β-positive macrophages during acute lung inflammation.Am J Respir Cell Mol Biol. 2015 Jul;53(1):50-9. doi: 10.1165/rcmb.2014-0289OC. Am J Respir Cell Mol Biol. 2015. PMID: 25375039 Free PMC article.
-
Global Deletion of TSPO Does Not Affect the Viability and Gene Expression Profile.PLoS One. 2016 Dec 1;11(12):e0167307. doi: 10.1371/journal.pone.0167307. eCollection 2016. PLoS One. 2016. PMID: 27907096 Free PMC article.
-
Radiopharmaceutical tracers for cardiac imaging.J Nucl Cardiol. 2018 Aug;25(4):1204-1236. doi: 10.1007/s12350-017-1131-5. Epub 2017 Dec 1. J Nucl Cardiol. 2018. PMID: 29196910 Free PMC article.
-
Crosstalk between CD64+MHCII+ macrophages and CD4+ T cells drives joint pathology during chikungunya.EMBO Mol Med. 2024 Mar;16(3):641-663. doi: 10.1038/s44321-024-00028-y. Epub 2024 Feb 8. EMBO Mol Med. 2024. PMID: 38332201 Free PMC article.
-
Visualization of acute liver damage induced by cycloheximide in rats using PET with [(18)F]FEDAC, a radiotracer for translocator protein (18 kDa).PLoS One. 2014 Jan 23;9(1):e86625. doi: 10.1371/journal.pone.0086625. eCollection 2014. PLoS One. 2014. PMID: 24466178 Free PMC article.
References
-
- Lopez AD, Murray CC (1998) The global burden of disease. 1990–2020. Nat Med 4: 1241–1243. - PubMed
-
- Rubenfeld GD, Caldwell E, Peabody E, Weaver J, Martin DP, et al. (2005) Incidence and outcomes of acute lung injury. N Engl J Med 353: 1685–1693. - PubMed
-
- Cheung AM, Tansey CM, Tomlinson G, Diaz-Granados N, Matte A, et al. (2006) Two-year outcomes, health care use, and costs of survivors of acute respiratory distress syndrome. Am J Respir Crit Care Med 174: 538–544. - PubMed
-
- Pauwels RA, Buist AS, Calverley PM, Jenkins CR (2001) Hurd SS; GOLD Scientific Committee (2001) Global strategy for the diagnosis, management, and prevention of chronic obstructive pulmonary disease. Am J Respir Crit Care Med 163: 1256–1276. - PubMed
MeSH terms
Substances
LinkOut - more resources
Full Text Sources
Other Literature Sources
Medical

