

Longitudinal beta regression models for analyzing health-related quality of life scores over time
- PMID: 22984825
- PMCID: PMC3528618
- DOI: 10.1186/1471-2288-12-144
Longitudinal beta regression models for analyzing health-related quality of life scores over time
Abstract
Background: Health-related quality of life (HRQL) has become an increasingly important outcome parameter in clinical trials and epidemiological research. HRQL scores are typically bounded at both ends of the scale and often highly skewed. Several regression techniques have been proposed to model such data in cross-sectional studies, however, methods applicable in longitudinal research are less well researched. This study examined the use of beta regression models for analyzing longitudinal HRQL data using two empirical examples with distributional features typically encountered in practice.
Methods: We used SF-6D utility data from a German older age cohort study and stroke-specific HRQL data from a randomized controlled trial. We described the conceptual differences between mixed and marginal beta regression models and compared both models to the commonly used linear mixed model in terms of overall fit and predictive accuracy.
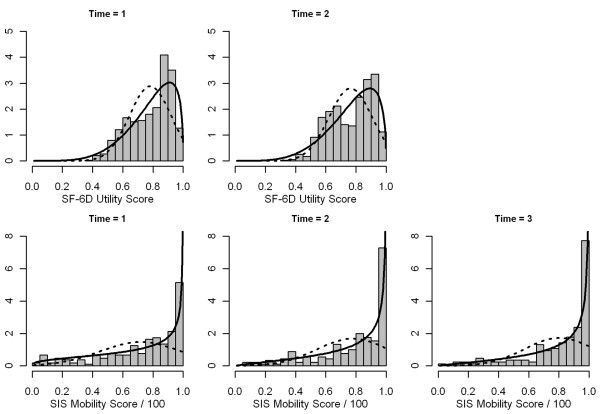
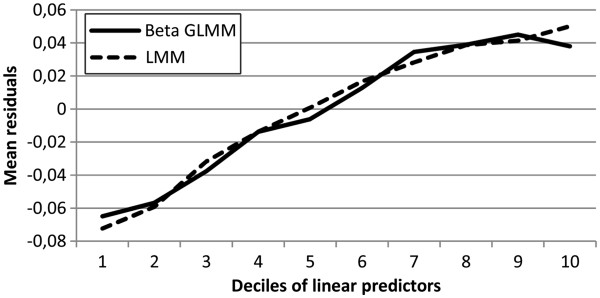
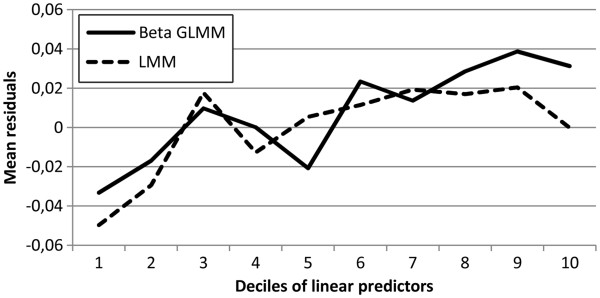
Results: At any measurement time, the beta distribution fitted the SF-6D utility data and stroke-specific HRQL data better than the normal distribution. The mixed beta model showed better likelihood-based fit statistics than the linear mixed model and respected the boundedness of the outcome variable. However, it tended to underestimate the true mean at the upper part of the distribution. Adjusted group means from marginal beta model and linear mixed model were nearly identical but differences could be observed with respect to standard errors.
Conclusions: Understanding the conceptual differences between mixed and marginal beta regression models is important for their proper use in the analysis of longitudinal HRQL data. Beta regression fits the typical distribution of HRQL data better than linear mixed models, however, if focus is on estimating group mean scores rather than making individual predictions, the two methods might not differ substantially.
Figures
References
-
- Calvert M, Blazeby J, Revicki D, Moher D, Brundage M. Reporting quality of life in clinical trials: a CONSORT extension. Lancet. 2011;378(9804):1684–1685. - PubMed
-
- Konig HH, Bernert S, Angermeyer MC, Matschinger H, Martinez M, Vilagut G, Haro JM, de Girolamo G, de Graaf R, Kovess V, Alonso J. Comparison of population health status in six european countries: results of a representative survey using the EQ-5D questionnaire. Med Care. 2009;47(2):255–261. - PubMed
-
- Pullenayegum EM, Tarride JE, Xie F, Goeree R, Gerstein HC, O'Reilly D. Analysis of health utility data when some subjects attain the upper bound of 1: are Tobit and CLAD models appropriate? Value Health. 2010;13(4):487–494. - PubMed
-
- Austin PC. A comparison of methods for analyzing health-related quality-of-life measures. Value Health. 2002;5(4):329–337. - PubMed
Publication types
MeSH terms
LinkOut - more resources
Full Text Sources
