

Modelling zoonotic diseases in humans: comparison of methods for hantavirus in Sweden
- PMID: 22984887
- PMCID: PMC3517350
- DOI: 10.1186/1476-072X-11-39
Modelling zoonotic diseases in humans: comparison of methods for hantavirus in Sweden
Abstract
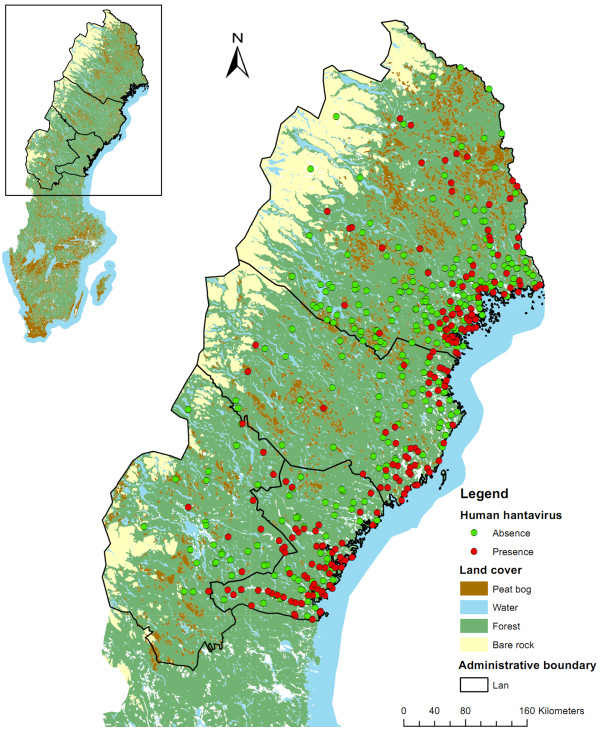
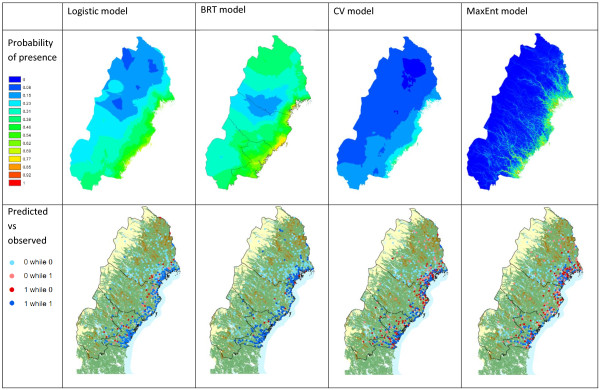
Because their distribution usually depends on the presence of more than one species, modelling zoonotic diseases in humans differs from modelling individual species distribution even though the data are similar in nature. Three approaches can be used to model spatial distributions recorded by points: based on presence/absence, presence/available or presence data. Here, we compared one or two of several existing methods for each of these approaches. Human cases of hantavirus infection reported by place of infection between 1991 and 1998 in Sweden were used as a case study. Puumala virus (PUUV), the most common hantavirus in Europe, circulates among bank voles (Myodes glareolus). In northern Sweden, it causes nephropathia epidemica (NE) in humans, a mild form of hemorrhagic fever with renal syndrome.Logistic binomial regression and boosted regression trees were used to model presence and absence data. Presence and available sites (where the disease may occur) were modelled using cross-validated logistic regression. Finally, the ecological niche model MaxEnt, based on presence-only data, was used.In our study, logistic regression had the best predictive power, followed by boosted regression trees, MaxEnt and cross-validated logistic regression. It is also the most statistically reliable but requires absence data. The cross-validated method partly avoids the issue of absence data but requires fastidious calculations. MaxEnt accounts for non-linear responses but the estimators can be complex. The advantages and disadvantages of each method are reviewed.
Figures
References
-
- Brotons L, Thuiller W, Araujo M, Hirzel A. Presence-absence versus presence-only modelling methods for predicting bird habitat suitability. Ecography. 2004;27:437–448. doi: 10.1111/j.0906-7590.2004.03764.x. - DOI
-
- Lobo J, Jimenez-Valverde A, Hortal J. The uncertain nature of absences and their importance in species distribution modelling. Ecography. 2010;33:103–114. doi: 10.1111/j.1600-0587.2009.06039.x. - DOI
-
- Boyce M, Vernier P, Nielsen S, Schmiegelow F. Evaluating resource selection functions. Ecol Model. 2002;157:281–300. doi: 10.1016/S0304-3800(02)00200-4. - DOI
Publication types
MeSH terms
LinkOut - more resources
Full Text Sources
Medical
