

Simplified equation to extract diffusion coefficients from confocal FRAP data
- PMID: 22984916
- PMCID: PMC3731631
- DOI: 10.1111/tra.12008
Simplified equation to extract diffusion coefficients from confocal FRAP data
Abstract
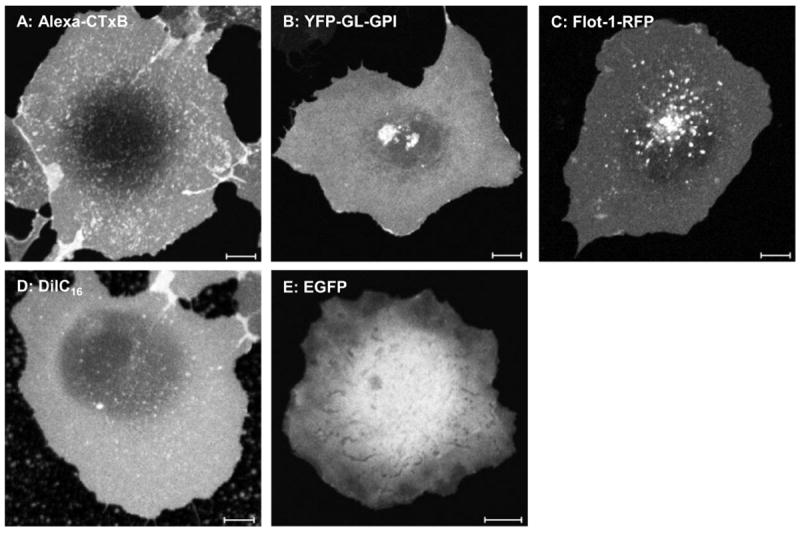
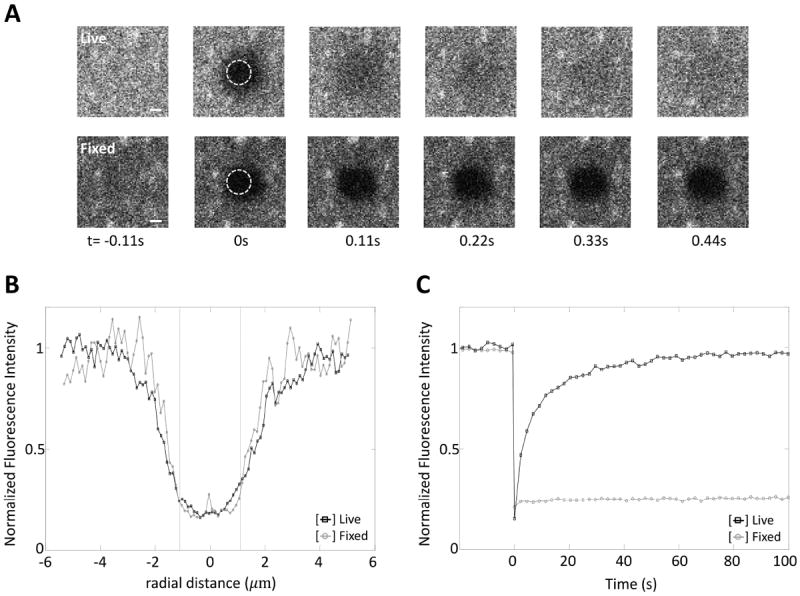
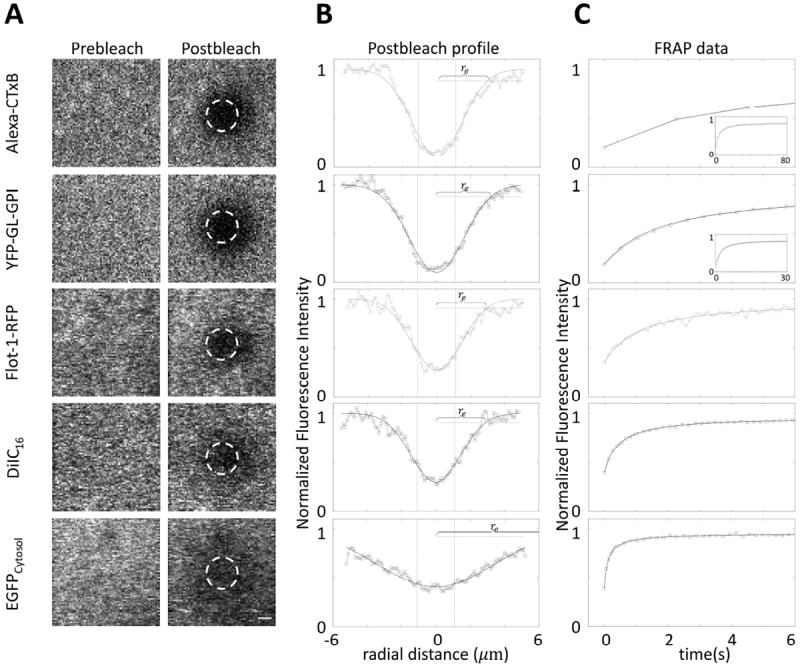
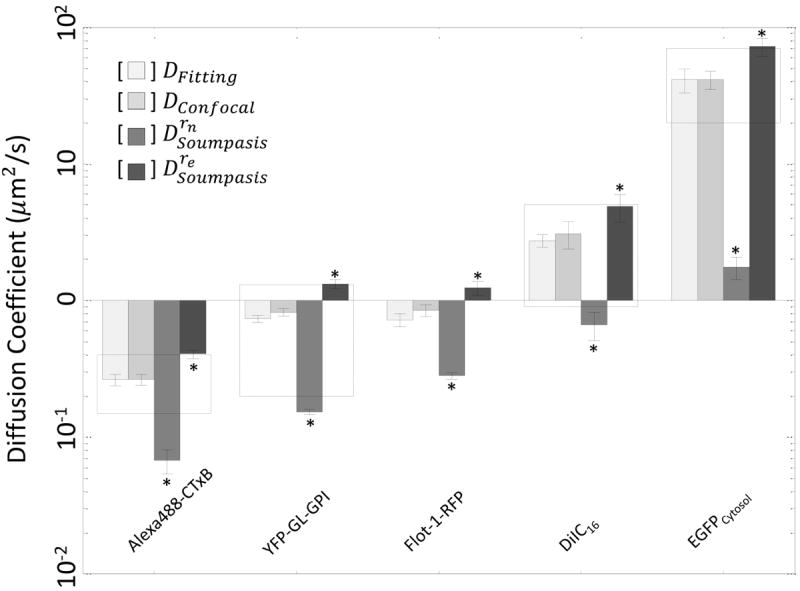
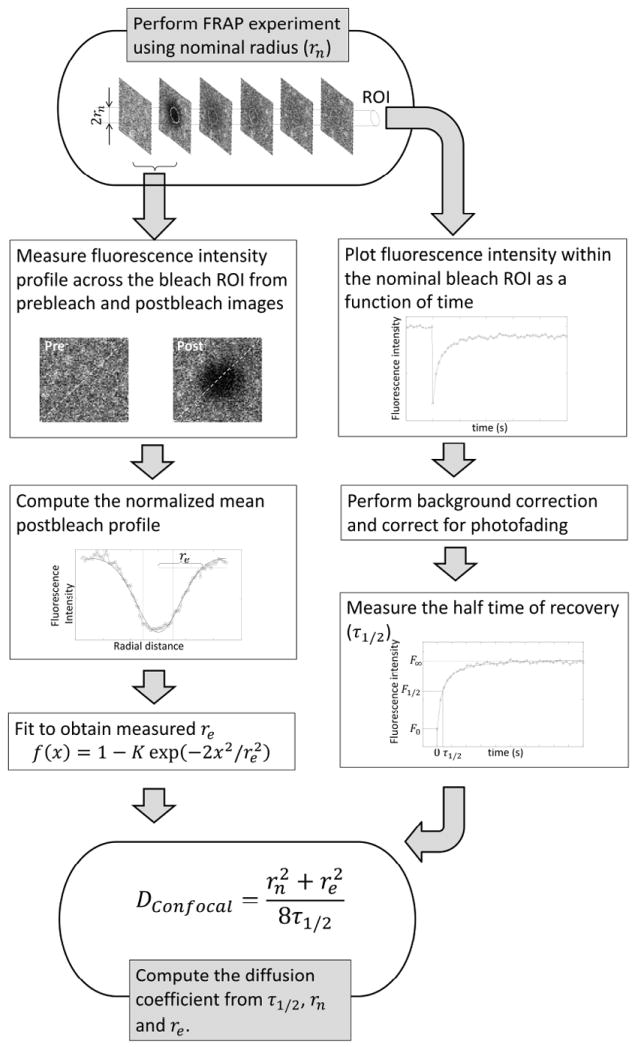
Quantitative measurements of diffusion can provide important information about how proteins and lipids interact with their environment within the cell and the effective size of the diffusing species. Confocal fluorescence recovery after photobleaching (FRAP) is one of the most widely accessible approaches to measure protein and lipid diffusion in living cells. However, straightforward approaches to quantify confocal FRAP measurements in terms of absolute diffusion coefficients are currently lacking. Here, we report a simplified equation that can be used to extract diffusion coefficients from confocal FRAP data using the half time of recovery and effective bleach radius for a circular bleach region, and validate this equation for a series of fluorescently labeled soluble and membrane-bound proteins and lipids. We show that using this approach, diffusion coefficients ranging over three orders of magnitude can be obtained from confocal FRAP measurements performed under standard imaging conditions, highlighting its broad applicability.
© 2012 John Wiley & Sons A/S.
Figures
Similar articles
-
Analysis of protein and lipid dynamics using confocal fluorescence recovery after photobleaching (FRAP).Curr Protoc Cytom. 2012 Oct;Chapter 2:Unit2.19. doi: 10.1002/0471142956.cy0219s62. Curr Protoc Cytom. 2012. PMID: 23042527 Free PMC article.
-
A generalization of theory for two-dimensional fluorescence recovery after photobleaching applicable to confocal laser scanning microscopes.Biophys J. 2009 Sep 2;97(5):1501-11. doi: 10.1016/j.bpj.2009.06.017. Biophys J. 2009. PMID: 19720039 Free PMC article.
-
A quantitative approach to analyze binding diffusion kinetics by confocal FRAP.Biophys J. 2010 Nov 3;99(9):2737-47. doi: 10.1016/j.bpj.2010.09.013. Biophys J. 2010. PMID: 21044570 Free PMC article.
-
Fluorescence Recovery after Photobleaching in Colloidal Science: Introduction and Application.ACS Biomater Sci Eng. 2022 Mar 14;8(3):1028-1048. doi: 10.1021/acsbiomaterials.1c01422. Epub 2022 Feb 24. ACS Biomater Sci Eng. 2022. PMID: 35201752 Review.
-
Recent applications of fluorescence recovery after photobleaching (FRAP) to membrane bio-macromolecules.Sensors (Basel). 2010;10(6):5927-48. doi: 10.3390/s100605927. Epub 2010 Jun 10. Sensors (Basel). 2010. PMID: 22219695 Free PMC article. Review.
Cited by
-
Molecular basis of VEGFR1 autoinhibition at the plasma membrane.Nat Commun. 2024 Feb 14;15(1):1346. doi: 10.1038/s41467-024-45499-2. Nat Commun. 2024. PMID: 38355851 Free PMC article.
-
Viscoelastic Liquid Matrix with Faster Bulk Relaxation Time Reinforces the Cell Cycle Arrest Induction of the Breast Cancer Cells via Oxidative Stress.Int J Mol Sci. 2022 Nov 24;23(23):14637. doi: 10.3390/ijms232314637. Int J Mol Sci. 2022. PMID: 36498966 Free PMC article.
-
Liquid and Hydrogel Phases of PrPC Linked to Conformation Shifts and Triggered by Alzheimer's Amyloid-β Oligomers.Mol Cell. 2018 Nov 1;72(3):426-443.e12. doi: 10.1016/j.molcel.2018.10.009. Epub 2018 Oct 25. Mol Cell. 2018. PMID: 30401430 Free PMC article.
-
Macromolecular Solute Transport in Supramolecular Hydrogels Spanning Dynamic to Quasi-Static States.ACS Appl Bio Mater. 2022 May 27:10.1021/acsabm.2c00165. doi: 10.1021/acsabm.2c00165. Online ahead of print. ACS Appl Bio Mater. 2022. PMID: 35623099 Free PMC article. Review.
-
Interplay of self-organization of microtubule asters and crosslinking protein condensates.PNAS Nexus. 2023 Jul 13;2(7):pgad231. doi: 10.1093/pnasnexus/pgad231. eCollection 2023 Jul. PNAS Nexus. 2023. PMID: 37497046 Free PMC article.
References
-
- Miyawaki A. Proteins on the move: insights gained from fluorescent protein technologies. Nat Rev Mol Cell Biol. 2011;12:656–668. - PubMed
Publication types
MeSH terms
Grants and funding
LinkOut - more resources
Full Text Sources
Other Literature Sources
Miscellaneous
