

Hospital-level variation in the use of intensive care
- PMID: 22985033
- PMCID: PMC3513618
- DOI: 10.1111/j.1475-6773.2012.01402.x
Hospital-level variation in the use of intensive care
Erratum in
- Health Serv Res. 2013 Apr;48(2 Pt 1):681
Abstract
Objective: To determine the extent to which hospitals vary in the use of intensive care, and the proportion of variation attributable to differences in hospital practice that is independent of known patient and hospital factors.
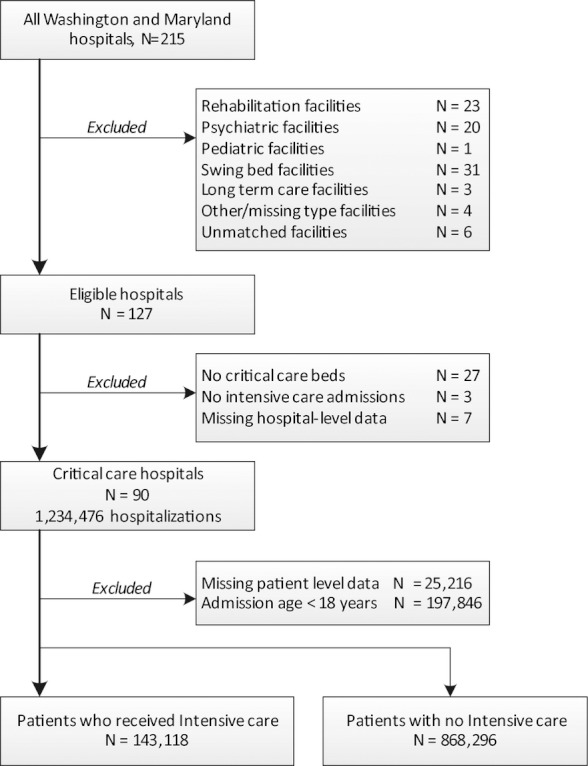
Data source: Hospital discharge data in the State Inpatient Database for Maryland and Washington States in 2006.
Study design: Cross-sectional analysis of 90 short-term, acute care hospitals with critical care capabilities. DATA COLLECTION/METHODS: We quantified the proportion of variation in intensive care use attributable to hospitals using intraclass correlation coefficients derived from mixed-effects logistic regression models after successive adjustment for known patient and hospital factors.
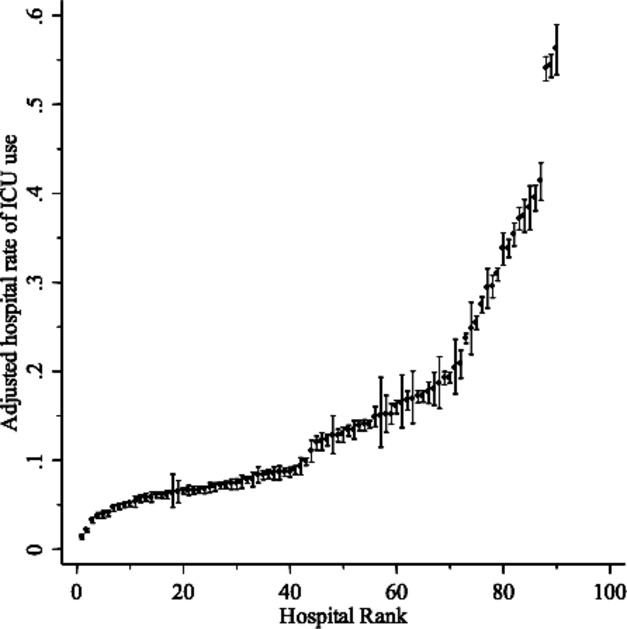
Principal findings: The proportion of hospitalized patients admitted to an intensive care unit (ICU) across hospitals ranged from 3 to 55 percent (median 12 percent; IQR: 9, 17 percent). After adjustment for patient factors, 19.7 percent (95 percent CI: 15.1, 24.4) of total variation in ICU use across hospitals was attributable to hospitals. When observed hospital characteristics were added, the proportion of total variation in intensive care use attributable to unmeasured hospital factors decreased by 26-14.6 percent (95 percent CI: 11, 18.3 percent).
Conclusions: Wide variability exists in the use of intensive care across hospitals, not attributable to known patient or hospital factors, and may be a target to improve efficiency and quality of critical care.
© Health Research and Educational Trust.
Figures
References
-
- Agency for Healthcare Research and Quality (AHRQ) 2008. “Inpatient Quality Indicators (IQI) Composite Measure Workgroup Final Report, March 2008” [accessed on October 1, 2010]. Available at http://www.qualityindicators.ahrq.gov/downloads/iqi/AHRQ_IQI_Workgroup_F.... - PubMed
-
- American Hospital Association. American Hospital Association Annual Survey Database for Fiscal Year 2001. Chicago, IL: American Hospital Association; 2001.
-
- Andersen R, Chen MS, Aday LA, Cornelius L. “Health Status and Medical Care Utilization”. Health Affairs (Millwood) 1987;6(1):136–56. - PubMed
-
- Angus DC, Barnato AE, Linde-Zwirble WT, Weissfeld LA, Watson RS, Rickert T, Rubenfeld GD. “Use of Intensive Care at the End of Life in the United States: An Epidemiologic Study”. Critical Care Medicine. 2004;32(3):638–43. - PubMed
Publication types
MeSH terms
Grants and funding
LinkOut - more resources
Full Text Sources
Medical
