

First growth curves based on the World Health Organization reference in a Nationally-Representative Sample of Pediatric Population in the Middle East and North Africa (MENA): the CASPIAN-III study
- PMID: 22985219
- PMCID: PMC3471000
- DOI: 10.1186/1471-2431-12-149
First growth curves based on the World Health Organization reference in a Nationally-Representative Sample of Pediatric Population in the Middle East and North Africa (MENA): the CASPIAN-III study
Abstract
Background: The World Health Organization (WHO) is in the process of establishing a new global database on the growth of school children and adolescents. Limited national data exist from Asian children, notably those living in the Middle East and North Africa (MENA). This study aimed to generate the growth chart of a nationally representative sample of Iranian children aged 10-19 years, and to explore how well these anthropometric data match with international growth references.
Methods: In this nationwide study, the anthropometric data were recorded from Iranian students, aged 10-19 years, who were selected by multistage random cluster sampling from urban and rural areas. Prior to the analysis, outliers were excluded from the features height-for-age and body mass index (BMI)-for-age using the NCHS/WHO cut-offs. The Box-Cox power exponential (BCPE) method was used to calculate height-for-age and BMI-for-age Z-scores for our study participants. Then, children with overweight, obesity, thinness, and severe thinness were identified using the BMI-for-age z-scores. Moreover, stunted children were detected using the height-for-age z-scores. The growth curve of the Iranian children was then generated from the z-scores, smoothed by cubic S-plines.
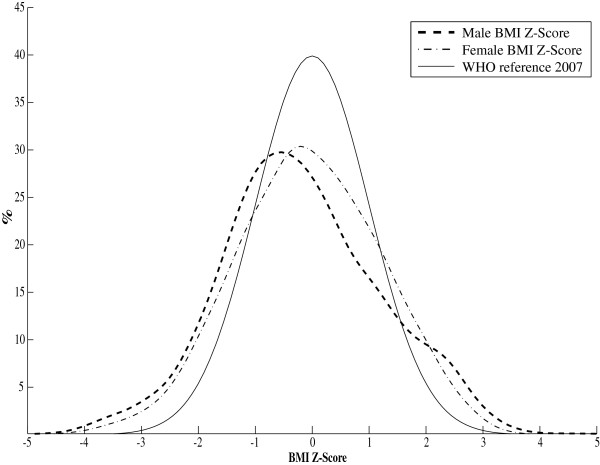
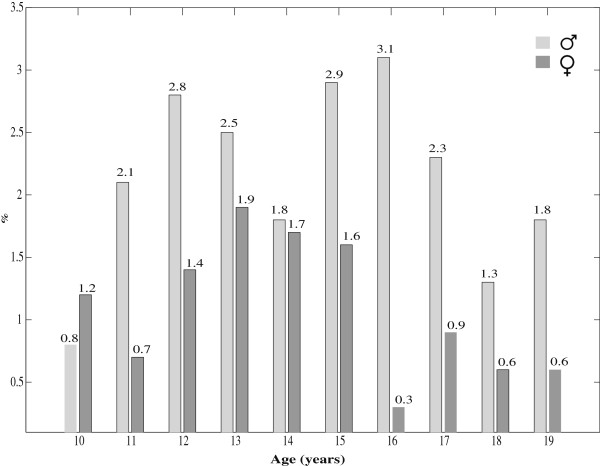
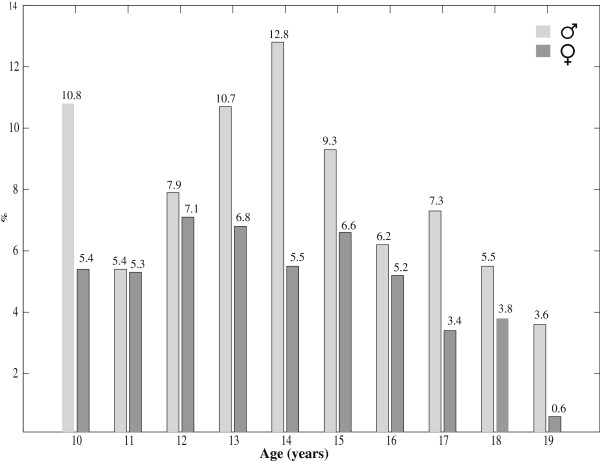
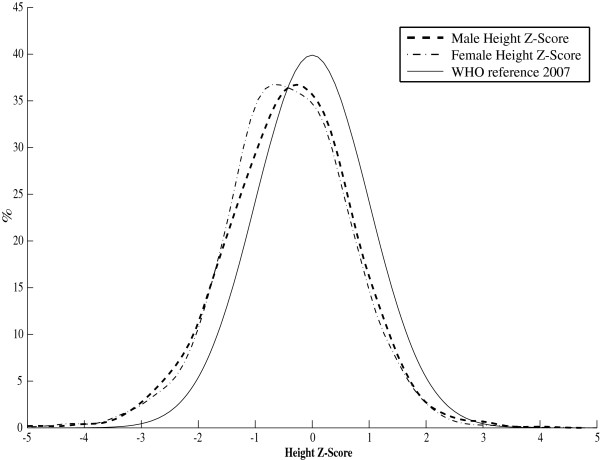
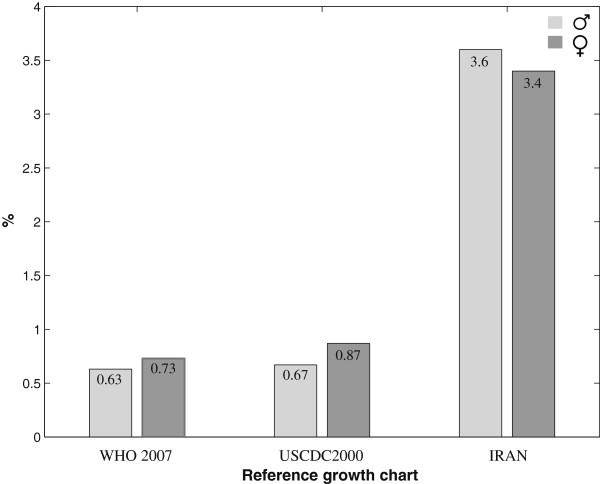
Results: The study population comprised 5430 school students consisting of 2312 (44%) participants aged 10-14 years , and 3118 (58%) with 15-19 years of age. Eight percent of the participants had low BMI (thinness: 6% and severe thinness: 2%), 20% had high BMI (overweight: 14% and obesity: 6%), and 7% were stunted. The prevalence rates of low and high BMI were greater in boys than in girls (P < 0.001). The mean BMI-for-age, and the average height-for-age of Iranian children aged 10-19 years were lower than the WHO 2007 and United states Centers for Disease Control and Prevention 2000 (USCDC2000) references.
Conclusions: The current growth curves generated from a national dataset may be included for establishing WHO global database on children's growth. Similar to most low-and middle income populations, Iranian children aged 10-19 years are facing a double burden of weight disorders, notably under- and over- nutrition, which should be considered in public health policy-making.
Figures
References
-
- Fayter D, Nixon J, Hartley S, Rithalia A, Butler G, Rudolf M, Glasziou P, Bland M, Stirk L, Westwood M. Effectiveness and cost-effectiveness of height-screening programmes during the primary school years: a systematic review. Arch Dis Child. 2008;93:278–284. doi: 10.1136/adc.2006.109843. - DOI - PubMed
-
- de Onis M, Garza C, Victoria CG, Bhan MK, Norum KR. The WHO Multicentre Growth Reference Study: Planning, study design and methodology. Food and Nutrition Bulletin. 2004;25:1–89. - PubMed
-
- Chukwunonso Ejike ECC, Chidi Ugwu E, Lawrence US. Physical growth and nutritional status of a cohort of semi-urban Nigerian adolescents. Pak J Nutr. 2010;9(4):392–397.
-
- Katz DL. et al.Public health strategies for preventing and controlling overweight and obesity in school and worksite settings: a report on recommendations of the Task Force on Community Preventive Services. Mortality and Morbidity Weekly Report. 2005;7:1–12. - PubMed
MeSH terms
LinkOut - more resources
Full Text Sources
Research Materials
