. 2012 Sep 18:12:209.
doi: 10.1186/1471-2180-12-209.

Single cell analysis of Vibrio harveyi uncovers functional heterogeneity in response to quorum sensing signals

Affiliations

Single cell analysis of Vibrio harveyi uncovers functional heterogeneity in response to quorum sensing signals

Claudia Anetzberger et al. BMC Microbiol. .

Abstract

Background: Vibrio harveyi and closely related species are important pathogens in aquaculture. A complex quorum sensing cascade involving three autoinducers controls bioluminescence and several genes encoding virulence factors. Single cell analysis of a V. harveyi population has already indicated intercellular heterogeneity in the production of bioluminescence. This study was undertaken to analyze the expression of various autoinducer-dependent genes in individual cells.

Results: Here we used reporter strains bearing promoter::gfp fusions to monitor the induction/repression of three autoinducer-regulated genes in wild type conjugates at the single cell level. Two genes involved in pathogenesis - vhp and vscP, which code for an exoprotease and a component of the type III secretion system, respectively, and luxC (the first gene in the lux operon) were chosen for analysis. The lux operon and the exoprotease gene are induced, while vscP is repressed at high cell density. As controls luxS and recA, whose expression is not dependent on autoinducers, were examined. The responses of the promoter::gfp fusions in individual cells from the same culture ranged from no to high induction. Importantly, simultaneous analysis of two autoinducer induced phenotypes, bioluminescence (light detection) and exoproteolytic activity (fluorescence of a promoter::gfp fusion), in single cells provided evidence for functional heterogeneity within a V. harveyi population.

Conclusions: Autoinducers are not only an indicator for cell density, but play a pivotal role in the coordination of physiological activities within the population.


Figures
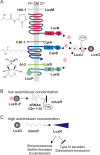
Figure 1
Figure 1
The QS signaling cascade of Vibrio harveyi .(A) In V. harveyi the AIs HAI-1, CAI-1 and AI-2 are synthesized by LuxM, CqsA and LuxS respectively, and are detected by the hybrid sensor kinases LuxN, CqsS and LuxQ (with its binding protein LuxP). The higher the AI concentration, the lower the autophosphorylation activity of the kinases [24]. Dashed lines marked with a ‘P’ indicate phosphotransfer reactions. H (histidine) and D (aspartate) denote phosphorylation sites. CM, cytoplasmic membrane; CP, cytoplasm; PP, periplasm. (B) In the absence of AIs, the phosphoryl group is transferred by phosphorelay via the histidine phosphotransfer protein LuxU to the σ54-dependent transcriptional activator LuxO. Phosphorylated LuxO activates transcription of five regulatory sRNAs (Qrr1-5), four of which, together with the chaperone Hfq, destabilize the mRNA for the master regulator LuxR. (C) In the presence of AIs, LuxO is dephosphorylated, and LuxR is produced. LuxR activates genes responsible for bioluminescence, biofilm formation and exoproteolytic activity, and represses genes involved in type III secretion and siderophore production
Figure 2
Figure 2
Characterization of AI-regulated gene activity in V. harveyi strains containing promoter::gfp reporter fusions. V. harveyi strains containing PluxC::gfp(A, B) and Pvhp::gfp(C, D) reporter fusions were grown to the mid-exponential growth phase (OD600 = 0.2), and single cell analysis was performed. 450 (PluxC::gfp) and 300 (Pvhp::gfp) cells were individually analyzed using ImageJ. In panels B and D, fluorescence and bioluminescence levels (normalized for cell size and expressed in arbitrary units) are plotted for individual cells bearing the reporter fusions indicated. The correlation coefficient r and the p-value are indicated. A regression line could be drawn only for strain PluxC::gfp (red). Panels A and C show phase-contrast (left), bioluminescence (middle) and fluorescence (right) views of cells expressing promoter::gfp fusions for luxC and vhp, respectively. The images in each row show the same field of view. Note the tight correlation between luminescence and luxC reporter expression in panel A. White arrows indicate two cells displaying signals of equal intensity in the bioluminescence and fluorescence channels. In panel C red arrows point to cells that exhibit high bioluminescence and low fluorescence or vice versa. Scale bar = 2.5 μm.
Figure 3
Figure 3
Growth-dependent analysis of the expression of AI-regulated genes at the single cell level.V. harveyi conjugants that carried one of the plasmids pCA2, pCA3, pCA4, pCA5, and pCA1 containing a promoter::gfp fusion driven by the luxC (blue), vhp (green), vscP (red), luxS (grey), or recA (dark grey) promoter, respectively, were cultivated, and at the indicated times the optical density (OD600) was determined (A) and single cell analysis was performed (B-F). At each time point the average fluorescence of the population was determined (A). The activity of luxC(B), vhp(C), vscP(D), luxS (E), and recA(F) promoters was followed in a growing population over time. Fluorescence levels were normalized for cell size and expressed in arbitrary units.
Figure 4
Figure 4
Simultaneous monitoring of AI-regulated bioluminescence and induction of Pvhp::gfp. The Pvhp::gfp reporter strain enables simultaneous measurement of two AI-dependent phenotypes, bioluminescence and exoproteolysis. Cells were cultivated, and single cell analysis was performed at the transition to the stationary phase. Panels A-C show a representative set of images of the same field viewed by phase contrast (A), luminescence (B), and fluorescence (C) microscopy. The yellow circle marks a cell with medium luminescence and fluorescence intensity. The blue circle indicates a cell with high luminescence intensity and no fluorescence. The green circle surrounds a cell with high fluorescence intensity and no luminescence. The red circle marks a dark cell (no fluorescence, no luminescence). The bar is 2.5 μm. Luminescence and fluorescence intensities (in a.u./cell) were quantitatively analyzed for 1,150 cells. For each channel the cells were grouped according to their signal intensity in no, medium, or high. (The separation in these groups is described in detail in the results part). Panel D shows the distribution of the various intensity classes plotted as percentage of the total number of cells analyzed.

Similar articles

Cited by

References

    1. Chai Y, Chu F, Kolter R, Losick R. Bistability and biofilm formation in Bacillus subtilis. Mol Microbiol. 2008;67:254–263. - PMC - PubMed
    1. Kearns DB, Losick R. Cell population heterogeneity during growth of Bacillus subtilis. Genes Dev. 2005;19:3083–3094. doi: 10.1101/gad.1373905. - DOI - PMC - PubMed
    1. Anetzberger C, Pirch T, Jung K. Heterogeneity in quorum sensing-regulated bioluminescence of Vibrio harveyi. Mol Microbiol. 2009;73:267–277. doi: 10.1111/j.1365-2958.2009.06768.x. - DOI - PubMed
    1. Waters CM, Bassler BL. Quorum sensing: Cell-to-cell communication in bacteria. Annu Rev Cell Dev Biol. 2005;21:319–346. doi: 10.1146/annurev.cellbio.21.012704.131001. - DOI - PubMed
    1. Lin B, Wang Z, Malanoski AP, O'Grady EA, Wimpee CF, Vuddhakul V, Alvers N Jr, Thompson FL, Gomez-Gil B, Vora GJ. Comparative genomic analysis identify the Vibrio harveyi genome sequenced strains BAA-1116 and HY01 as Vibrio campbellii. Environ Microbiol Rep. 2010;2:81–89. - PMC - PubMed

Publication types

MeSH terms

Substances