

The study of two barley type I-like MADS-box genes as potential targets of epigenetic regulation during seed development
- PMID: 22985436
- PMCID: PMC3499179
- DOI: 10.1186/1471-2229-12-166
The study of two barley type I-like MADS-box genes as potential targets of epigenetic regulation during seed development
Abstract
Background: MADS-box genes constitute a large family of transcription factors functioning as key regulators of many processes during plant vegetative and reproductive development. Type II MADS-box genes have been intensively investigated and are mostly involved in vegetative and flowering development. A growing number of studies of Type I MADS-box genes in Arabidopsis, have assigned crucial roles for these genes in gamete and seed development and have demonstrated that a number of Type I MADS-box genes are epigenetically regulated by DNA methylation and histone modifications. However, reports on agronomically important cereals such as barley and wheat are scarce.
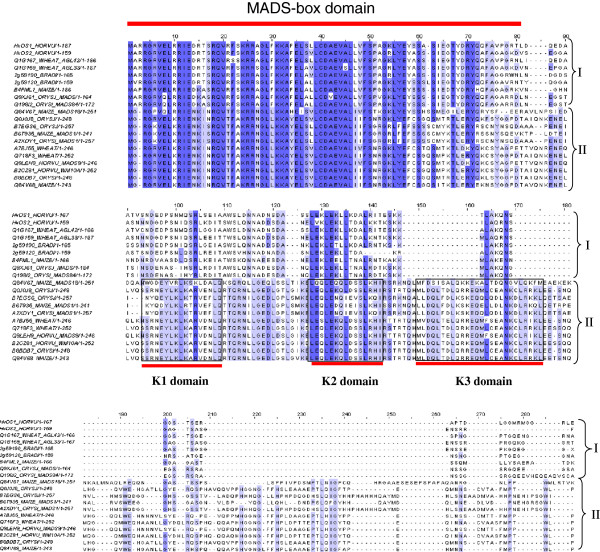
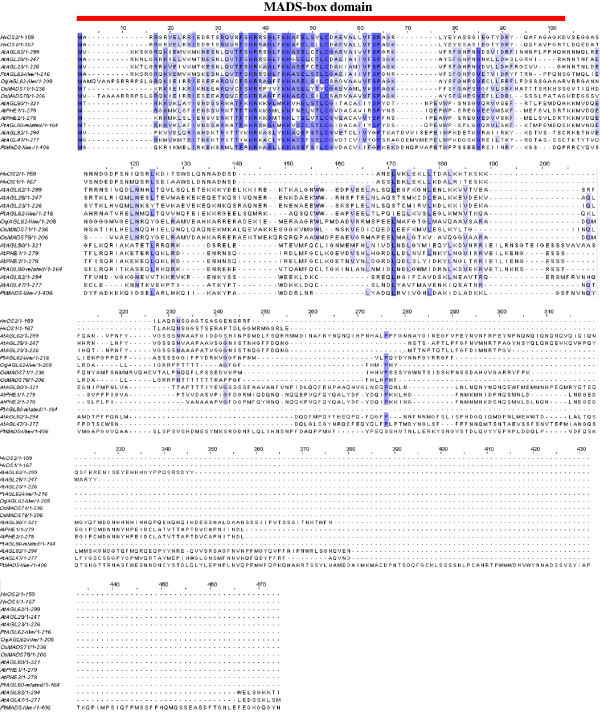
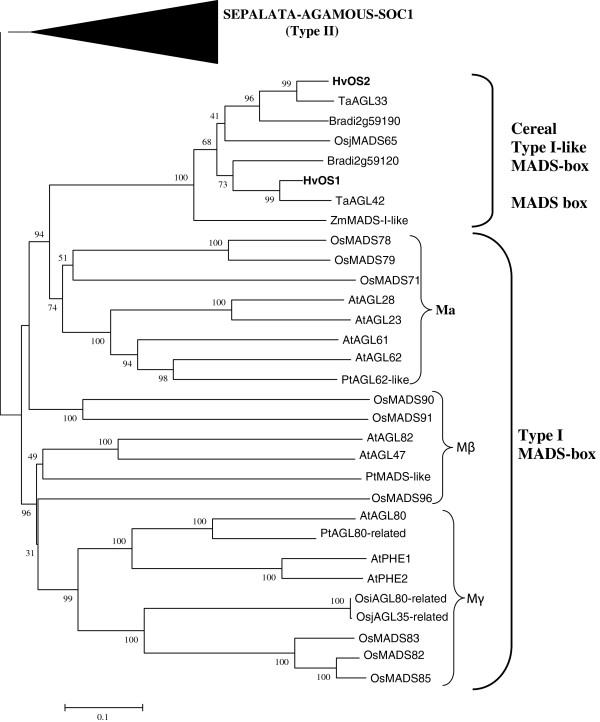
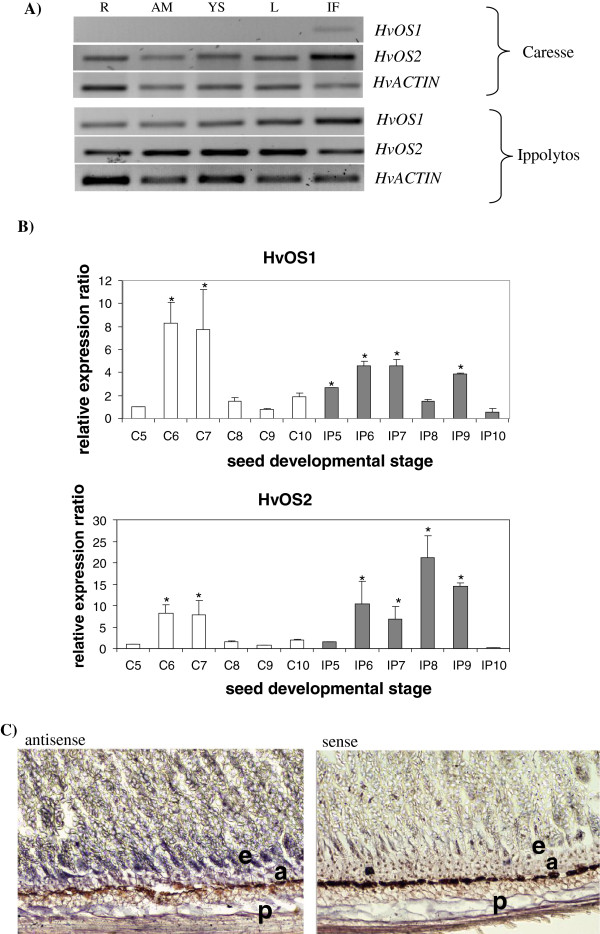
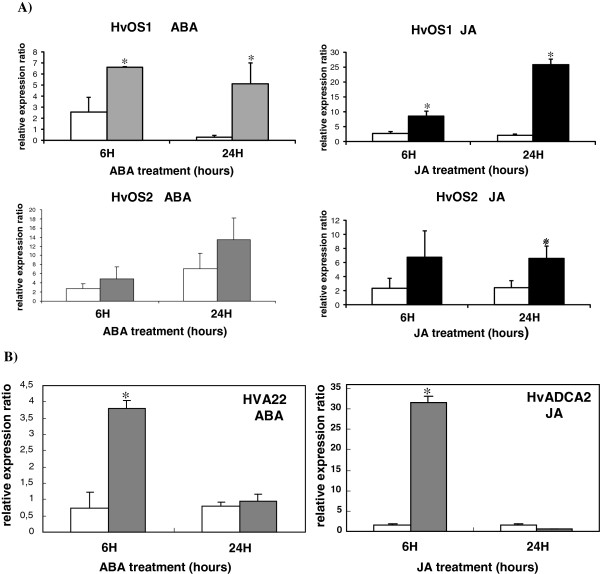
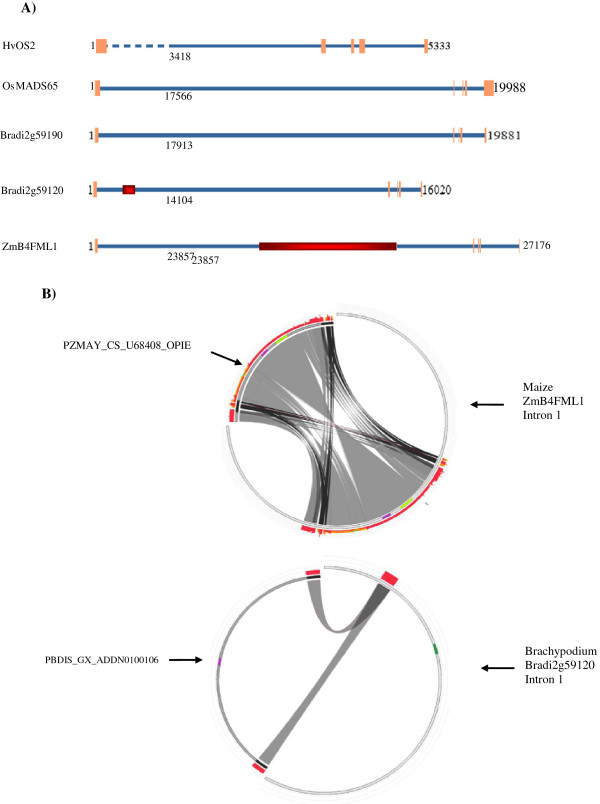
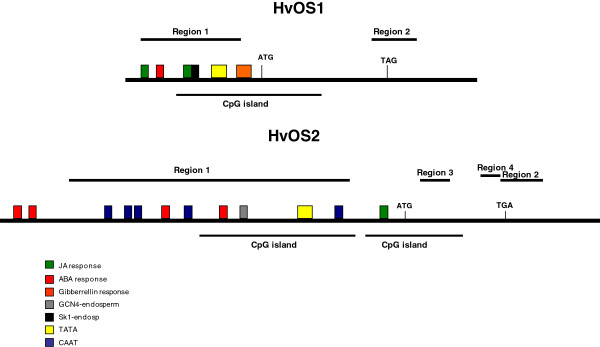
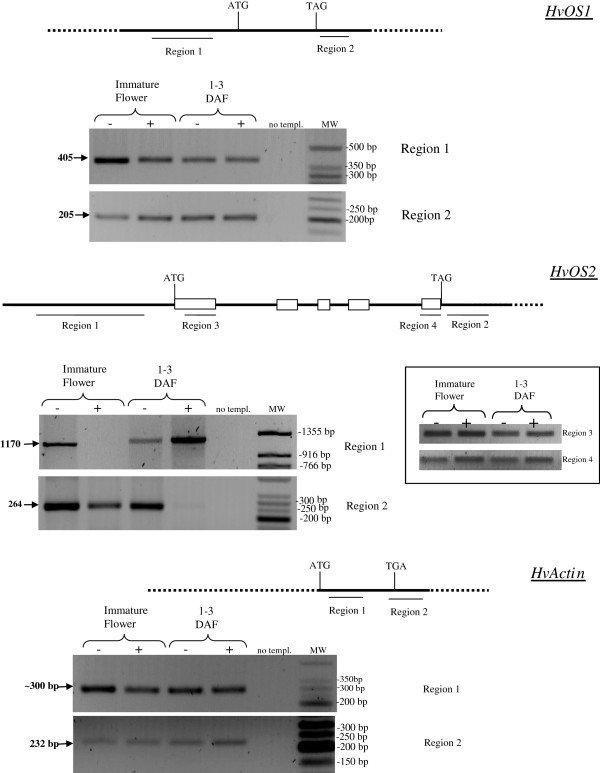
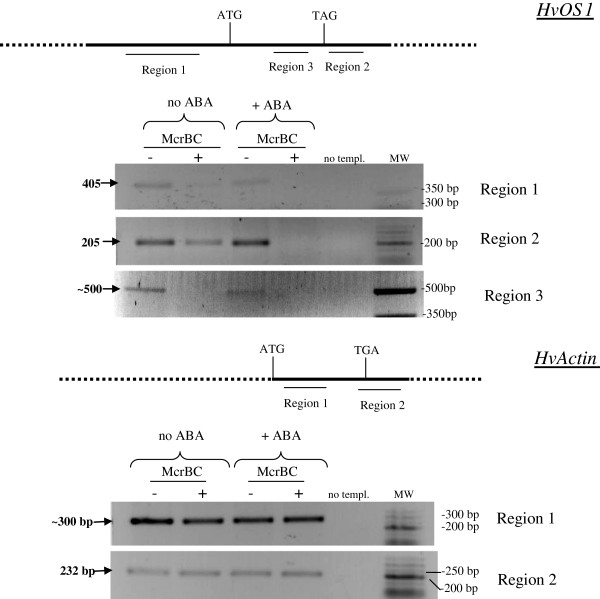
Results: Here we report the identification and characterization of two Type I-like MADS-box genes, from barley (Hordeum vulgare), a monocot cereal crop of high agronomic importance. Protein sequence and phylogenetic analysis showed that the putative proteins are related to Type I MADS-box proteins, and classified them in a distinct cereal clade. Significant differences in gene expression among seed developmental stages and between barley cultivars with varying seed size were revealed for both genes. One of these genes was shown to be induced by the seed development- and stress-related hormones ABA and JA whereas in situ hybridizations localized the other gene to specific endosperm sub-compartments. The genomic organization of the latter has high conservation with the cereal Type I-like MADS-box homologues and the chromosomal position of both genes is close to markers associated with seed quality traits. DNA methylation differences are present in the upstream and downstream regulatory regions of the barley Type I-like MADS-box genes in two different developmental stages and in response to ABA treatment which may be associated with gene expression differences.
Conclusions: Two barley MADS-box genes were studied that are related to Type I MADS-box genes. Differential expression in different seed developmental stages as well as in barley cultivars with different seed size was evidenced for both genes. The two barley Type I MADS-box genes were found to be induced by ABA and JA. DNA methylation differences in different seed developmental stages and after exogenous application of ABA is suggestive of epigenetic regulation of gene expression. The study of barley Type I-like MADS-box genes extends our investigations of gene regulation during endosperm and seed development in a monocot crop like barley.
Figures
Similar articles
-
Epigenetic chromatin modifiers in barley: IV. The study of barley polycomb group (PcG) genes during seed development and in response to external ABA.BMC Plant Biol. 2010 Apr 21;10:73. doi: 10.1186/1471-2229-10-73. BMC Plant Biol. 2010. PMID: 20409301 Free PMC article.
-
The study of a barley epigenetic regulator, HvDME, in seed development and under drought.BMC Plant Biol. 2013 Oct 31;13:172. doi: 10.1186/1471-2229-13-172. BMC Plant Biol. 2013. PMID: 24175960 Free PMC article.
-
Cloning and characterization of SOC1 homologs in barley (Hordeum vulgare) and their expression during seed development and in response to vernalization.Physiol Plant. 2012 Sep;146(1):71-85. doi: 10.1111/j.1399-3054.2012.01610.x. Epub 2012 May 10. Physiol Plant. 2012. PMID: 22409646
-
Dissecting the role of MADS-box genes in monocot floral development and diversity.J Exp Bot. 2018 Apr 27;69(10):2435-2459. doi: 10.1093/jxb/ery086. J Exp Bot. 2018. PMID: 29718461 Review.
-
The emerging importance of type I MADS box transcription factors for plant reproduction.Plant Cell. 2011 Mar;23(3):865-72. doi: 10.1105/tpc.110.081737. Epub 2011 Mar 4. Plant Cell. 2011. PMID: 21378131 Free PMC article. Review.
Cited by
-
Changes in RNA Splicing in Developing Soybean (Glycine max) Embryos.Biology (Basel). 2013 Nov 21;2(4):1311-37. doi: 10.3390/biology2041311. Biology (Basel). 2013. PMID: 24833227 Free PMC article.
-
Participation of FaTRAB1 Transcription Factor in the Regulation of FaMADS1 Involved in ABA-Dependent Ripening of Strawberry Fruit.Foods. 2023 Apr 26;12(9):1802. doi: 10.3390/foods12091802. Foods. 2023. PMID: 37174341 Free PMC article.
-
The Role of FLOWERING LOCUS C Relatives in Cereals.Front Plant Sci. 2020 Dec 22;11:617340. doi: 10.3389/fpls.2020.617340. eCollection 2020. Front Plant Sci. 2020. PMID: 33414801 Free PMC article. Review.
-
Mapping quantitative trait loci for yield-related traits and predicting candidate genes for grain weight in maize.Sci Rep. 2019 Nov 6;9(1):16112. doi: 10.1038/s41598-019-52222-5. Sci Rep. 2019. PMID: 31695075 Free PMC article.
-
Seed response to strigolactone is controlled by abscisic acid-independent DNA methylation in the obligate root parasitic plant, Phelipanche ramosa L. Pomel.J Exp Bot. 2015 Jun;66(11):3129-40. doi: 10.1093/jxb/erv119. Epub 2015 Mar 28. J Exp Bot. 2015. PMID: 25821070 Free PMC article.
References
Publication types
MeSH terms
Substances
LinkOut - more resources
Full Text Sources
Other Literature Sources
