

Ischemia-reperfusion impairs blood-brain barrier function and alters tight junction protein expression in the ovine fetus
- PMID: 22986172
- PMCID: PMC3490041
- DOI: 10.1016/j.neuroscience.2012.08.043
Ischemia-reperfusion impairs blood-brain barrier function and alters tight junction protein expression in the ovine fetus
Abstract
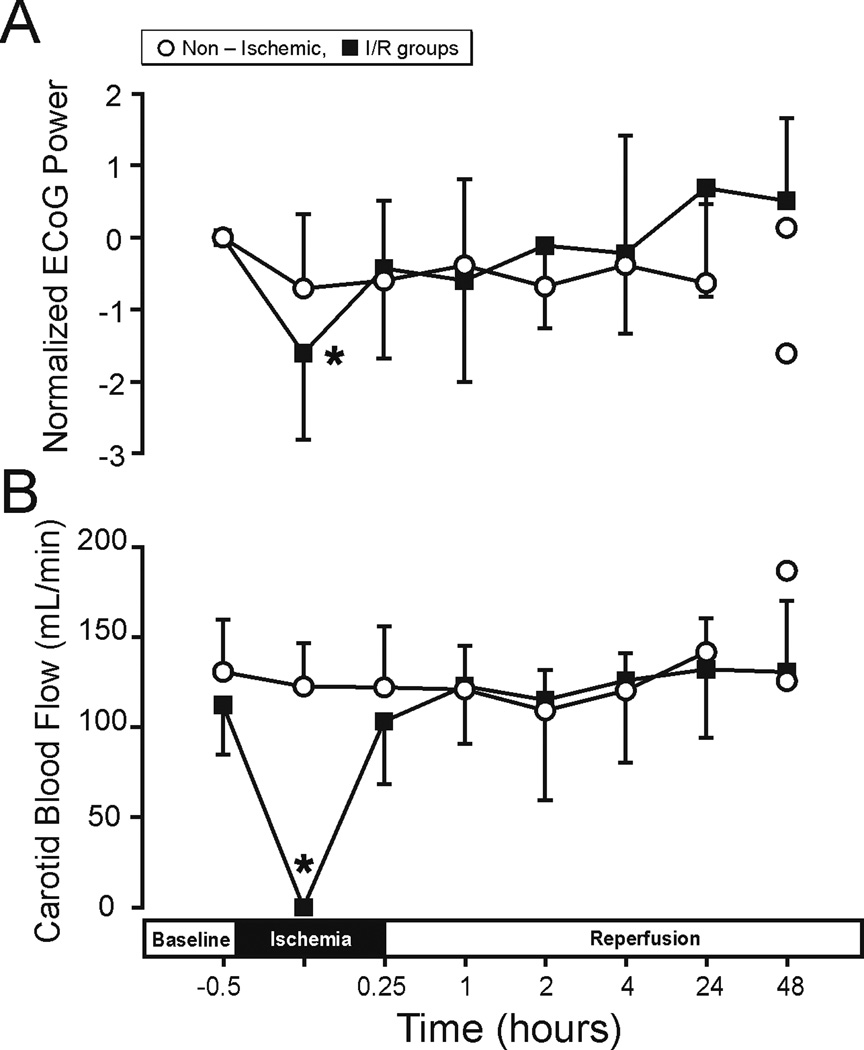
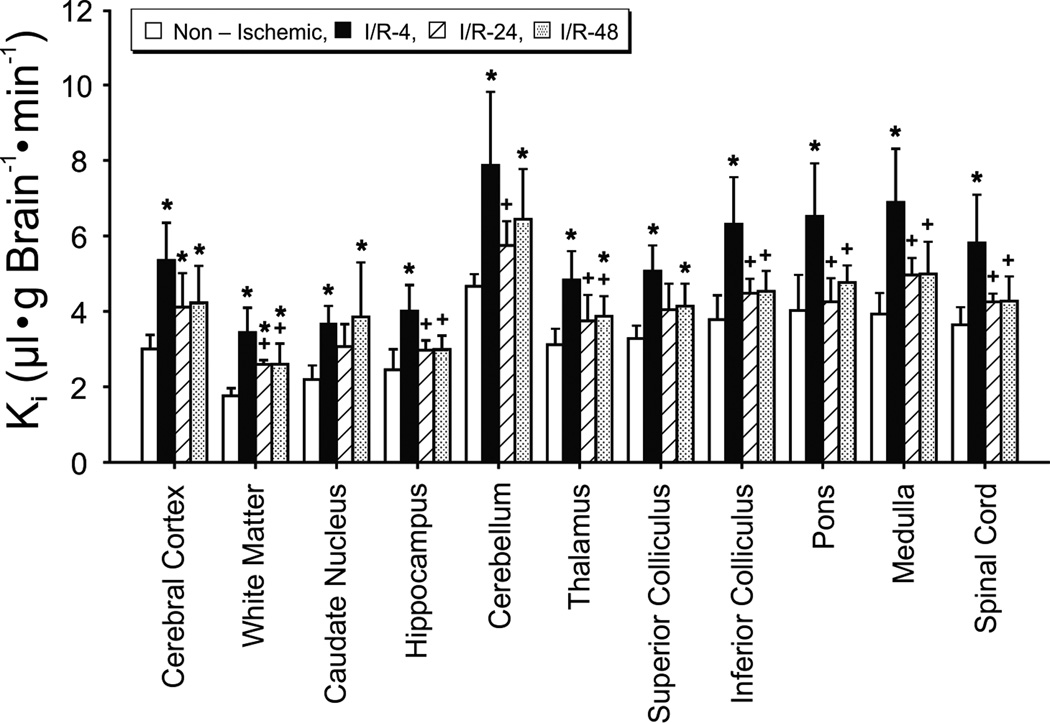
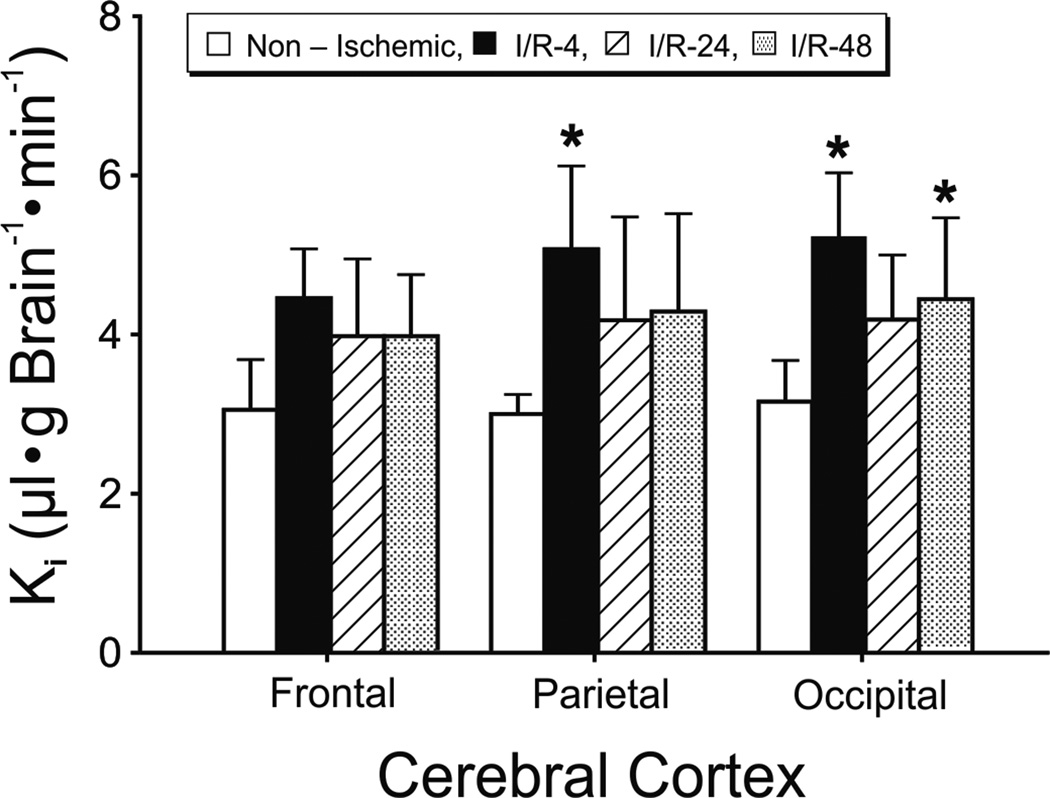
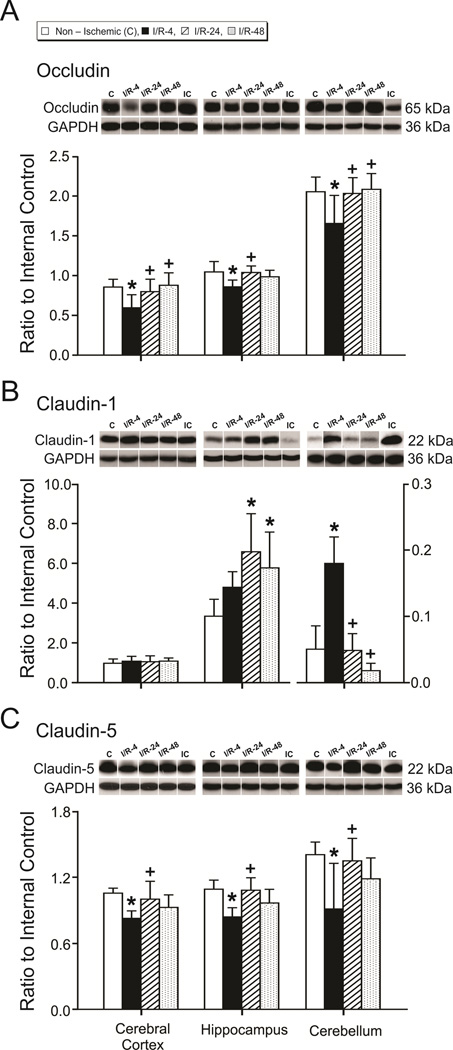
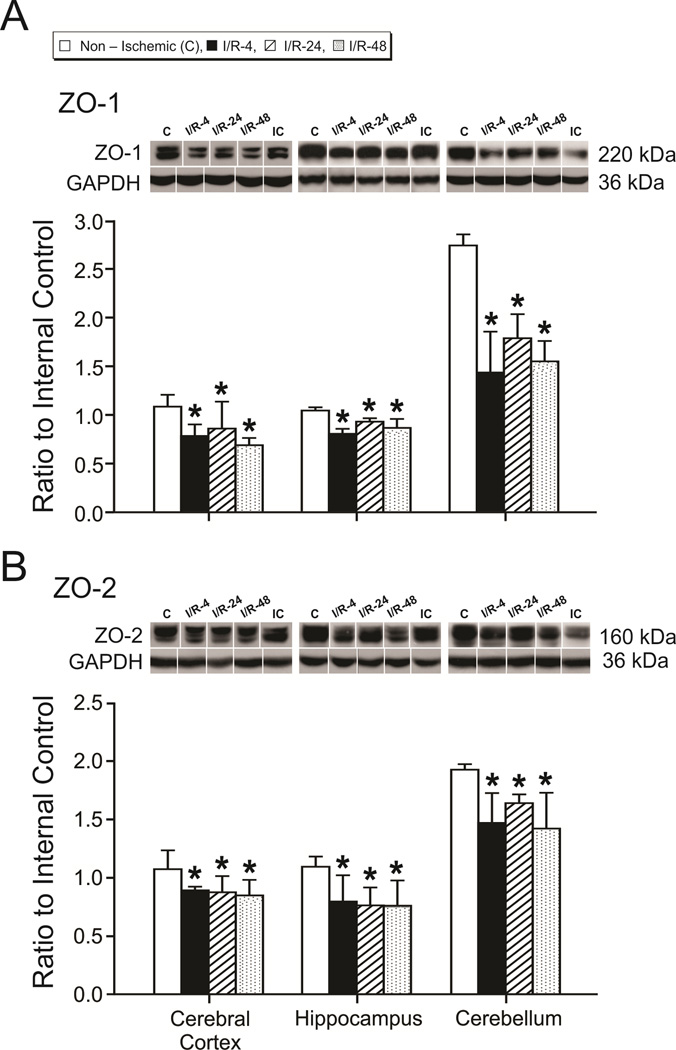
The blood-brain barrier is a restrictive interface between the brain parenchyma and the intravascular compartment. Tight junctions contribute to the integrity of the blood-brain barrier. Hypoxic-ischemic damage to the blood-brain barrier could be an important component of fetal brain injury. We hypothesized that increases in blood-brain barrier permeability after ischemia depend upon the duration of reperfusion and that decreases in tight junction proteins are associated with the ischemia-related impairment in blood-brain barrier function in the fetus. Blood-brain barrier function was quantified with the blood-to-brain transfer constant (K(i)) and tight junction proteins by Western immunoblot in fetal sheep at 127 days of gestation without ischemia, and 4, 24, or 48 h after ischemia. The largest increase in K(i) (P<0.05) was 4 h after ischemia. Occludin and claudin-5 expressions decreased at 4 h, but returned toward control levels 24 and 48 h after ischemia. Zonula occludens-1 and -2 decreased after ischemia. Inverse correlations between K(i) and tight junction proteins suggest that the decreases in tight junction proteins contribute to impaired blood-brain barrier function after ischemia. We conclude that impaired blood-brain barrier function is an important component of hypoxic-ischemic brain injury in the fetus, and that increases in quantitatively measured barrier permeability (K(i)) change as a function of the duration of reperfusion after ischemia. The largest increase in permeability occurs 4 h after ischemia and blood-brain barrier function improves early after injury because the blood-brain barrier is less permeable 24 and 48 than 4 h after ischemia. Changes in the tight junction molecular composition are associated with increases in blood-brain barrier permeability after ischemia.
Copyright © 2012 IBRO. Published by Elsevier Ltd. All rights reserved.
Conflict of interest statement
The authors have no duality or conflicts of interests to declare.
Figures

Similar articles
-
Anti-IL-6 neutralizing antibody modulates blood-brain barrier function in the ovine fetus.FASEB J. 2015 May;29(5):1739-53. doi: 10.1096/fj.14-258822. Epub 2015 Jan 21. FASEB J. 2015. PMID: 25609424 Free PMC article.
-
Maternal glucocorticoid exposure alters tight junction protein expression in the brain of fetal sheep.Am J Physiol Heart Circ Physiol. 2010 Jan;298(1):H179-88. doi: 10.1152/ajpheart.00828.2009. Epub 2009 Oct 23. Am J Physiol Heart Circ Physiol. 2010. PMID: 19855054 Free PMC article.
-
Neutralizing anti-interleukin-1β antibodies modulate fetal blood-brain barrier function after ischemia.Neurobiol Dis. 2015 Jan;73:118-29. doi: 10.1016/j.nbd.2014.09.007. Epub 2014 Sep 26. Neurobiol Dis. 2015. PMID: 25258170 Free PMC article.
-
Barrier function in the peripheral and central nervous system-a review.Pflugers Arch. 2017 Jan;469(1):123-134. doi: 10.1007/s00424-016-1920-8. Epub 2016 Dec 12. Pflugers Arch. 2017. PMID: 27957611 Review.
-
Tight junction proteins: from barrier to tumorigenesis.Cancer Lett. 2013 Aug 28;337(1):41-8. doi: 10.1016/j.canlet.2013.05.038. Epub 2013 Jun 3. Cancer Lett. 2013. PMID: 23743355 Free PMC article. Review.
Cited by
-
Ischemia reduces inter-alpha inhibitor proteins in the brain of the ovine fetus.Dev Neurobiol. 2017 Jun;77(6):726-737. doi: 10.1002/dneu.22451. Epub 2016 Nov 17. Dev Neurobiol. 2017. PMID: 27618403 Free PMC article.
-
C1 Esterase Inhibitor Reduces BBB Leakage and Apoptosis in the Hypoxic Developing Mouse Brain.Neuromolecular Med. 2020 Mar;22(1):31-44. doi: 10.1007/s12017-019-08560-8. Epub 2019 Aug 14. Neuromolecular Med. 2020. PMID: 31414384
-
Hyperoside protects the blood-brain barrier from neurotoxicity of amyloid beta 1-42.Neural Regen Res. 2018 Nov;13(11):1974-1980. doi: 10.4103/1673-5374.239445. Neural Regen Res. 2018. PMID: 30233072 Free PMC article.
-
The Neurovascular Unit: Effects of Brain Insults During the Perinatal Period.Front Neurosci. 2020 Jan 22;13:1452. doi: 10.3389/fnins.2019.01452. eCollection 2019. Front Neurosci. 2020. PMID: 32038147 Free PMC article. Review.
-
Neutralizing anti-interleukin-1β antibodies reduce ischemia-related interleukin-1β transport across the blood-brain barrier in fetal sheep.Neuroscience. 2017 Mar 27;346:113-125. doi: 10.1016/j.neuroscience.2016.12.051. Epub 2017 Jan 9. Neuroscience. 2017. PMID: 28089577 Free PMC article.
References
-
- Armstead WM, Mirro R, Thelin OP, Shibata M, Zuckerman SL, Shanklin DR, Busija DW, Leffler CW. Polyethylene glycol superoxide dismutase and catalase attenuate increased blood-brain barrier permeability after ischemia in piglets. Stroke. 1992;23:755–762. - PubMed
-
- Baskaya MK, Rao AM, Dogan A, Donaldson D, Dempsey RJ. The biphasic opening of the blood-brain barrier in the cortex and hippocampus after traumatic brain injury in rats. Neurosci Lett. 1997;226:33–36. - PubMed
-
- Belayev L, Busto R, Zhao W, Ginsberg MD. Quantitative evaluation of blood-brain barrier permeability following middle cerebral artery occlusion in rats. Brain Res. 1996;739:88–96. - PubMed
-
- Betz AL. An overview of the multiple functions of the blood-brain barrier. NIDA Res Monogr. 1992;120:54–72. - PubMed
Publication types
MeSH terms
Substances
Grants and funding
LinkOut - more resources
Full Text Sources
Other Literature Sources
