. 2012 Nov 6;13(11):992-6.
doi: 10.1038/embor.2012.139.

Open and closed domains in the mouse genome are configured as 10-nm chromatin fibres

Affiliations

Open and closed domains in the mouse genome are configured as 10-nm chromatin fibres

Eden Fussner et al. EMBO Rep. .

Abstract

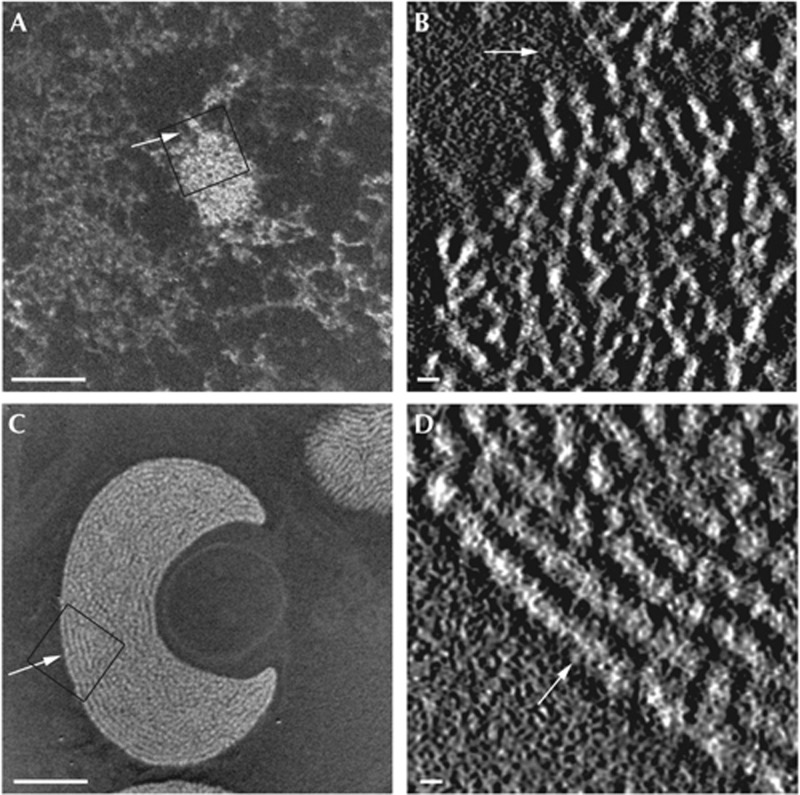
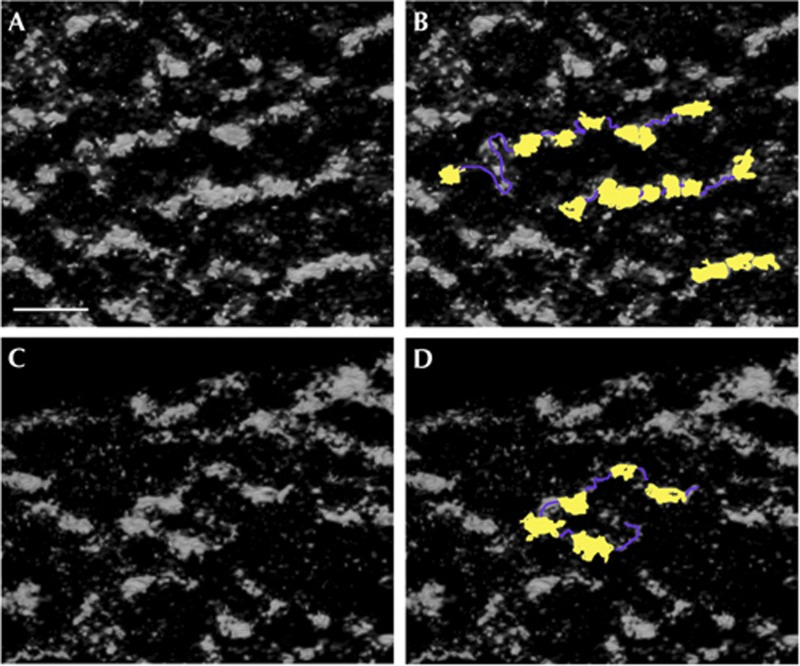
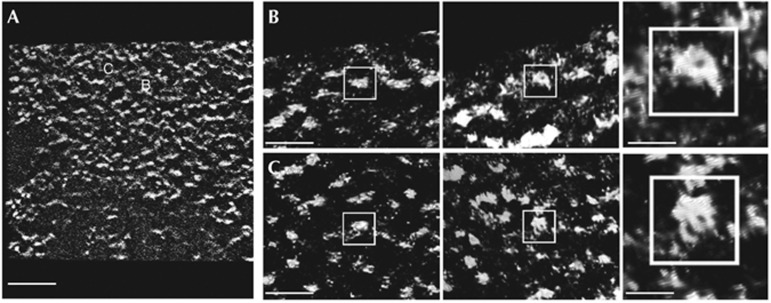
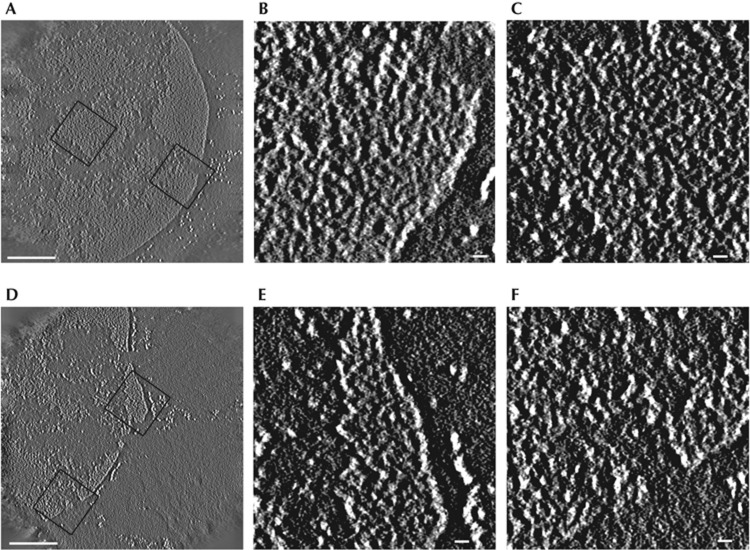
The mammalian genome is compacted to fit within the confines of the cell nucleus. DNA is wrapped around nucleosomes, forming the classic "beads-on-a-string" 10-nm chromatin fibre. Ten-nanometre chromatin fibres are thought to condense into 30-nm fibres. This structural reorganization is widely assumed to correspond to transitions between active and repressed chromatin, thereby representing a chief regulatory event. Here, by combining electron spectroscopic imaging with tomography, three-dimensional images are generated, revealing that both open and closed chromatin domains in mouse somatic cells comprise 10-nm fibres. These findings indicate that the 30-nm chromatin model does not reflect the true regulatory structure in vivo.


Conflict of interest statement

The authors declare that they have no conflict of interest.

Figures

Figure 1
Figure 1
ESI-tomographic analysis reveals the MEF nucleus is populated exclusively by 10-nm chromatin fibres and is able to detect both 10- and 30-nm chromatin fibres in situ. (A) An ESI phosphorus map of a MEF nucleus, chromatin fibres (white on black background), where all the chromatin fibres are projected onto a single image plane, and (B) central plane of the tomogram generated from this nucleus of an enlarged region of the chromocentre shown in A (box). (C) Phosphorus map and (D) central plane through the tomogram of an entire starfish sperm nuclei. The arrow illustrates rotation between the phosphorus map and the tomogram. Thirty-nanometre chromatin fibres in the field (box) are oriented parallel to the plane of the section. Scale bar, 500 nm in (A,C), and 30 nm in (B,D). ESI, electron spectroscopic imaging; MEF, mouse embryonic fibroblast.
Figure 2
Figure 2
Ten-nanometre nucleosomal chromatin fibres in a mouse embryonic fibroblast chromocentre are visualized using ESI tomography in situ. Tomographic slices of phosphorus maps in (A,C) showing strings of nucleosomes, with cartoon representations in (B,D); nucleosomes are false coloured yellow and intervening linker DNA purple. Scale bar, 50 nm in all panels. ESI, electron spectroscopic imaging.
Figure 3
Figure 3
Nucleosome, both side and en face views, are resolved using ESI tomography, enabling visualization within a MEF chromocentre in situ. (A) Central slice of the MEF chromocentre tomogram rendered with Chimera (chromatin in white on black background). (B,C) Two examples of nucleosome structures visualized with phosphorus map reconstructions showing side views (left) and en face views (middle) and digitally zoomed (right) of individual nucleosomes. Scale bar, 100 nm in (A), 34 nm in (B) and 12 nm in high-magnification insets (right panels). ESI, electron spectroscopic imaging; MEF, mouse embryonic fibroblast.
Figure 4
Figure 4
Chromatin fibres in mouse tissues comprise exclusively 10-nm chromatin fibres. (A) Central plane of the tomogram of a spleen lymphocyte nucleus where individual chromatin fibres can now be resolved using ESI tomography. Enlarged regions (boxes) are shown in (B,C), revealing the 10-nm chromatin fibres that populate these highly compact domains prevalent in spleen lymphocytes. (D) Central slice of phosphorus map tomogram (white on black background) of a liver nucleus from mouse tissue; both open and closed chromatin domains populate these nuclei in this tissue type. The chromatin fibres within the open and closed domains are distinguishable and found to be 10 nm, enlarged regions (boxes) in (E,F). Scale bar, 0.5 μm in panels (A,D) and 30 nm in panels (B,C,E,F). ESI, electron spectroscopic imaging.

Comment in

References

    1. Belmont AS, Bruce K (1994) Visualization of G1 chromosomes: a folded, twisted, supercoiled chromonema model of interphase chromatid structure. J Cell Biol 127: 287–302 - PMC - PubMed
    1. Finch JT, Klug A (1976) Solenoidal model for superstructure in chromatin. Proc Natl Acad Sci USA 73: 1897–1901 - PMC - PubMed
    1. Gilbert N, Boyle S, Fiegler H, Woodfine K, Carter NP, Bickmore WA (2004) Chromatin architecture of the human genome: gene-rich domains are enriched in open chromatin fibers. Cell 118: 555–566 - PubMed
    1. Kruithof M, Chien FT, Routh A, Logie C, Rhodes D, van Noort J (2009) Single-molecule force spectroscopy reveals a highly compliant helical folding for the 30-nm chromatin fiber. Nat Struct Mol Biol 16: 534–540 - PubMed
    1. Robinson PJ, Fairall L, Huynh VA, Rhodes D (2006) EM measurements define the dimensions of the ‘30-nm’ chromatin fiber: evidence for a compact, interdigitated structure. Proc Natl Acad Sci USA 103: 6506–6511 - PMC - PubMed

Publication types