

Morbid obesity rates continue to rise rapidly in the United States
- PMID: 22986681
- PMCID: PMC3527647
- DOI: 10.1038/ijo.2012.159
Morbid obesity rates continue to rise rapidly in the United States
Abstract
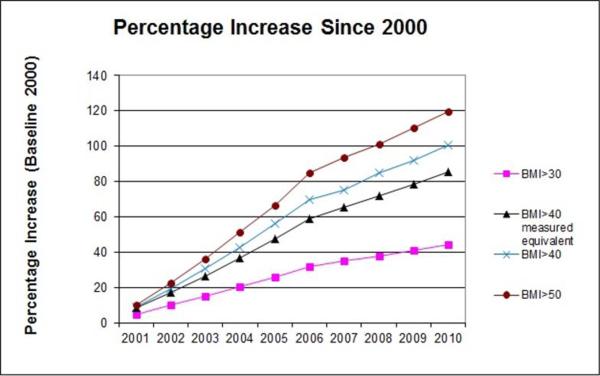
Clinically severe or morbid obesity (body mass index (BMI) >40 or 50 kg m(-2)) entails far more serious health consequences than moderate obesity for patients, and creates additional challenges for providers. The paper provides time trends for extreme weight categories (BMI >40 and >50 kg m(-2)) until 2010, using data from the Behavioral Risk Factor Surveillance System. Between 2000 and 2010, the prevalence of a BMI >40 kg m(-2) (type III obesity), calculated from self-reported height and weight, increased by 70%, whereas the prevalence of BMI >50 kg m(-2) increased even faster. Although the BMI rates at every point in time are higher among Hispanics and Blacks, there were no significant differences in trends between them and non-Hispanic Whites. The growth rate appears to have slowed down since 2005. Adjusting for self-report biases, we estimate that in 2010 15.5 million adult Americans or 6.6% of the population had an actual BMI >40 kg m(-2). The prevalence of clinically severe obesity continues to be increasing, although less rapidly in more recent years than prior to 2005.
Figures
References
-
- Flegal KM, Carroll MD, Kit BK, Ogden CL. Prevalence of obesity and trends in the distribution of body mass index among US adults, 1999–2010. JAMA. 2012;307(5):491–497. - PubMed
-
- Centers for Disease Control and Prevention (CDC) Vital signs: state-specific obesity prevalence among adult - United States, 2009. MMWR Morb Mortal Wkly Rep. 2010;59(30):951–955. - PubMed
-
- Sturm R. Increases in clinically severe obesity in the US: 1986–2000. Archives of Internal Medicine. 2003;163(18):2146–2148. - PubMed
Publication types
MeSH terms
Grants and funding
LinkOut - more resources
Full Text Sources
Medical
