Comparative Study
. 2012 Oct;22(10):2080-93.
doi: 10.1002/hipo.22066.

Layer V perirhinal cortical ensemble activity during object exploration: a comparison between young and aged rats

Affiliations
Comparative Study

Layer V perirhinal cortical ensemble activity during object exploration: a comparison between young and aged rats

S N Burke et al. Hippocampus. 2012 Oct.

Abstract

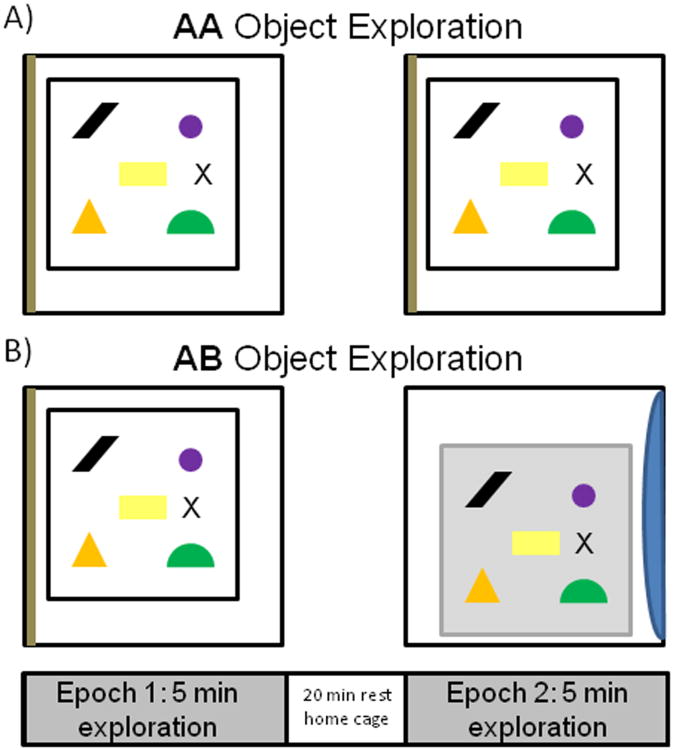
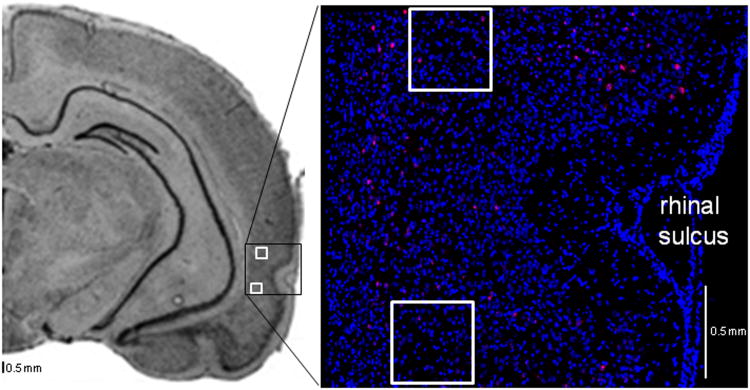
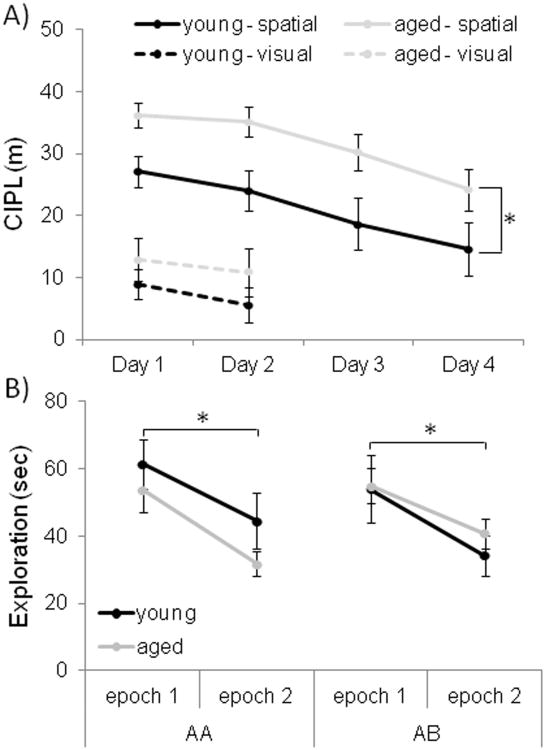
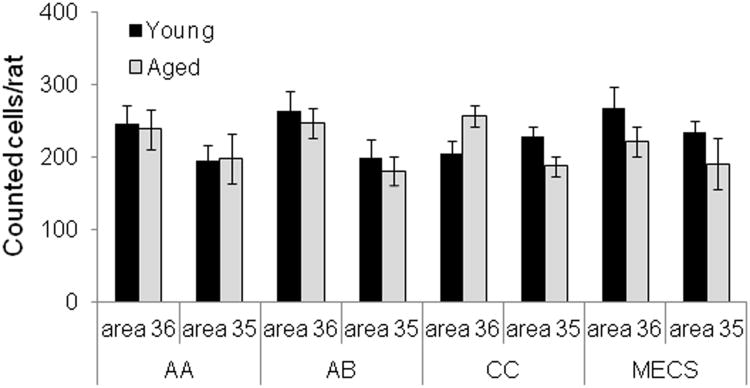
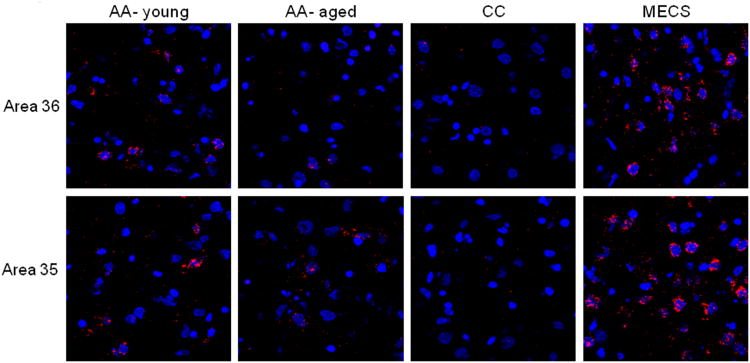
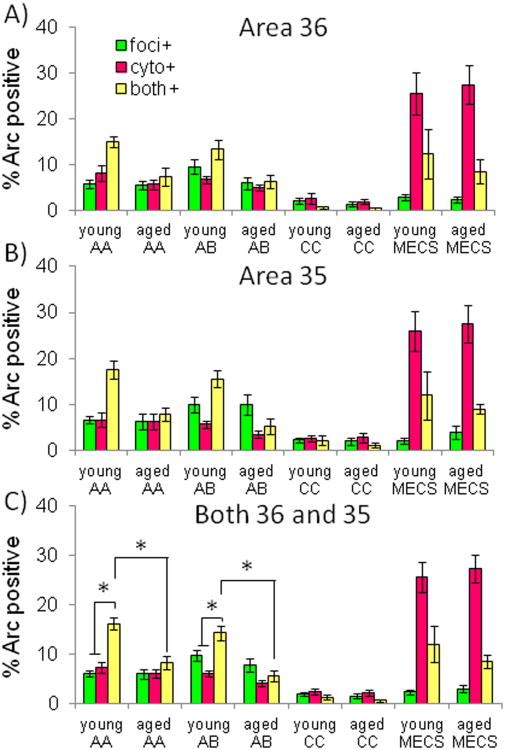
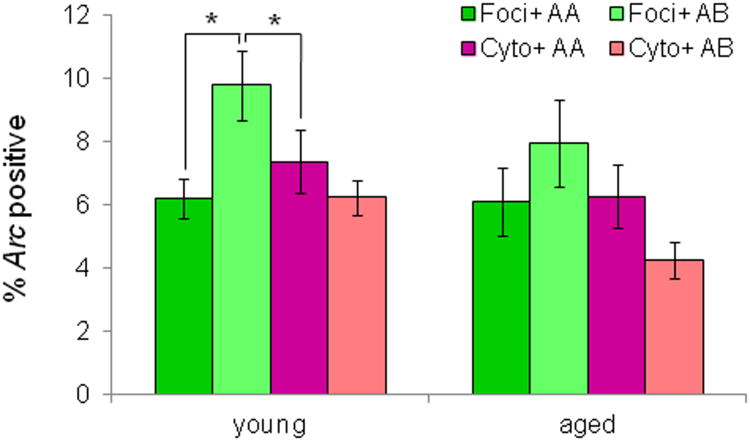
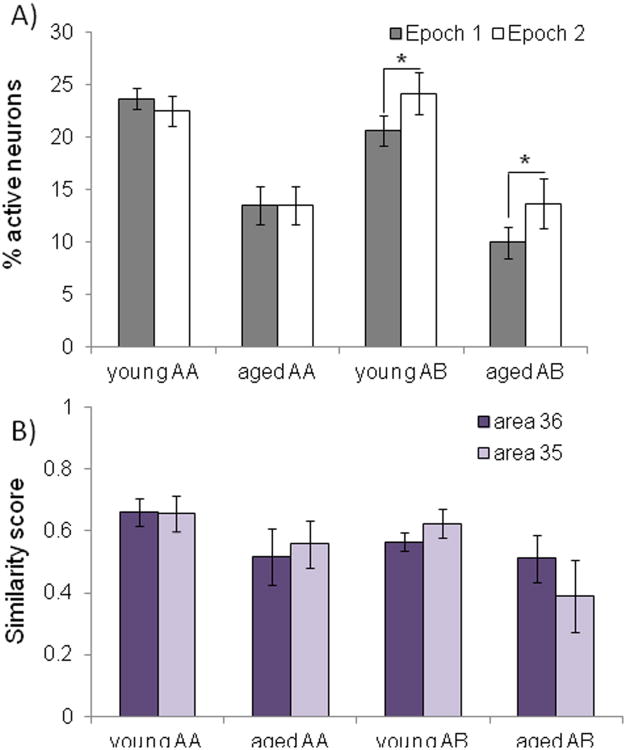
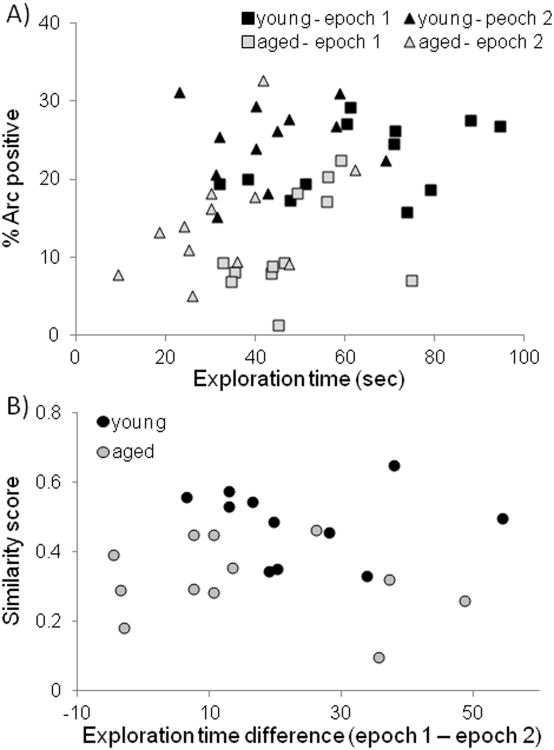
Object recognition memory requires the perirhinal cortex (PRC) and this cognitive function declines during normal aging. Recent electrophysiological recordings from young rats have shown that neurons in Layer V of the PRC are activated by three-dimensional objects. Thus, it is possible that age-related object recognition deficits result from alterations in PRC neuron activity in older animals. To examine this, the present study used cellular compartment analysis of temporal activity by fluorescence in situ hybridization (catFISH) with confocal microscopy to monitor cellular distributions of activity-induced Arc RNA in layer V of the PRC. Activity was monitored during two distinct epochs of object exploration. In one group of rats (6 young/6 aged) animals were placed in a familiar testing arena and allowed to explore five different three-dimensional objects for two 5-min sessions separated by a 20-min rest (AA). The second group of animals (6 young/6 aged) also explored the same objects for two 5-min sessions, but the environment was changed between the first and the second epoch (AB). Behavioral data showed that both age groups spent less time exploring objects during the second epoch, even when the environment changed, indicating successful recognition. Although the proportion of active neurons between epochs did not change in the AA group, in the AB group more neurons were active during epoch 2 of object exploration. This recruitment of neurons into the active neural ensemble could serve to signal that familiar stimuli are being encountered in a new context. When numbers of Arc positive neurons were compared between age groups, the old rats had significantly lower proportions of Arc-positive PRC neurons in both the AA and AB behavioral conditions. These data support the hypothesis that age-associated functional alterations in the PRC contribute to declines in stimulus recognition over the lifespan.


Figures

Figure 1
Figure 1. Schematic of object exploration conditions
A) After 2 days of habituation to arena A for 10 min/day, a rat in the AA condition was placed in the arena at the position marked by an “X” to freely explore 5 distinct novel objects (epoch 1). After 5 min, the rat was returned to its home cage to rest for 20 min, and then was returned to the same arena in the same room. The rat was again placed in arena A at the position marked by “X” and allowed to explore the same 5 objects for 5 min (epoch 2). B) After 2 days of habituation to both arena A and arena B for 10 min/day, a rat in the AB condition was placed in arena A for epoch 1 at the position marked by an “X” and allowed to freely explore 5 distinct novel objects (epoch 1). As in the AA group, the rat was then returned to the home cage to rest for 20 min. For the epoch 2 of exploration, the rat was taken to a different room and placed in arena B at the position marked by an “X” and allowed to freely explore the same 5 objects from epoch 1 for another 5 min.
Figure 2
Figure 2. Perirhinal cortical areas sampled for confocal microscopy
The left panel shows a coronal section of a rat brain (from Paxinos and Watson, 1998) with the PRC outlined (black box). Images were obtained between 4.0 and 6.5 mm posterior to bregma from layer V of PRC areas 36 and 35, as indicated by the white squares. The more dorsal white square marks the sample taken from area 36 and the ventral square is in area 35. The right panel is a mosaic image of the PRC with fluorescently labeled cell bodies (blue) and Arc mRNA (red) from a rat that explored objects.
Figure 3
Figure 3. Morris swim task and object exploration behavior
(A) The X-axis is the day of testing and the Y-axis is the mean corrected integrated path length (CIPL) score. Higher CIPL scores indicate longer path lengths to reach the escape platform. All rats completed 4 days of spatial trials (solid lines) in which the platform was hidden below the surface of the water. These spatial trials were followed by 2 days of visually-cued trials in which the platform was visible (dashed lines). During the spatial trials, the aged (grey) rats had significantly longer CIPL scores compared with the young (black) rats (F[3,60] = 13.79, p<0.001; repeated-measures ANVOA). During the 2 days of visual testing, when the platform was raised above the surface of the water, there was no significant difference between the performances of young versus aged rats (F[1,20] = 1.14, p = 0.29; repeated-measures ANOVA). Error bars represent +/−1 standard error of the mean. (B) The X-axis indicates the epoch and behavioral condition and the Y-axis is the total amount of time spent exploring the 5 objects for epoch 1 (grey) and epoch 2 (white). Both the young and aged rats spent significantly more time exploring the 5 objects during epoch 1 compared to epoch 2 (F[1,20] = 24.77, p < 0.001; repeated-measures ANOVA). The reduction in exploration time between epochs did not interact significantly with age group (F[1,20] = 0.52, p = 0.48; repeated-measures ANOVA), or behavioral condition F[1,20] = 0.12, p = 0.73; repeated-measures ANOVA). Error bars represent +/− standard error of the mean and asterisks indicate statistical significance.
Figure 4
Figure 4. Mean # of cells analyzed per rat
The Y axis is the mean number of neurons included in the analysis of Arc expression plotted for the different subregions of perirhinal cortex (PRC; area 36 and area 35) and behavioral conditions in young (dark) and aged (light) rats. The mean number of cells counted per rat did not differ significantly between the young and aged rats (F[1, 78] = 1.89, p = 0.17) or between behavioral conditions (F[3, 78] = 0.10, p = 0.96). Area 36 had significantly more neurons than area 35 (F[1, 78] = 13.05, p < 0.01), however. Error bars represent +/− standard error of the mean.
Figure 5
Figure 5. Representative PRC images for the different behavioral conditions
Eight different single planes taken from confocal image stacks analyzed for Arc catFISH for area 36 (top row) and area 35 (bottom row). Each column shows data from a different condition and blue spots are cell nuclei stained with Sytox counterstain and red signal corresponds to Arc mRNA. Note that the images from the CC rat (second panels from right) show lower levels of Arc signal while the MECS condition (right panels) images show relatively more Arc labeling. The images from the AA – young and AA – aged rats both have intermediate levels of Arc labeling.
Figure 6
Figure 6. The distribution ofArcin layer V of the PRC of young and aged rats
The Y-axes show the percent of cells that were positively labeled for Arc foci (foci+; green), cytoplasm (cyto+; purple), or both (both+; yellow) in area 36 (A), area 35 (B), and both regions together (C) plotted against the different age groups and experimental conditions. Arc expression did not vary significantly between areas 35 and 36 (F[1,78] = 0.83, p = 0.37), but there were significantly more Arc positive neurons in the young rats compared to the aged animals for both the AA (p < 0.01) and AB conditions (p < 0.001). In the MECS group there was a significantly higher proportion of cyto+ neurons compared to the other groups (p < 0.01 for all comparisons). Moreover, in the young rats, both the AA and AB groups had a significantly higher proportion of neurons with both+ compared to foci+ or cyto+. This indicates that in the object exploration groups the majority of active neurons fired during both behavioral epochs. Finally, in the AB group there were significantly more foci+ neurons compared to cyto+ (p < 0.05), suggesting that changing the environmental context lead to an increase in active neural ensemble. Error bars represent +/− standard error of the mean and asterisks indicate statistical significance.
Figure 7
Figure 7. The effect of changing context on epoch 2 activity
The percent of Arc positive neurons with foci+ and cyto+ labeling for the different age groups and behavioral conditions. In the young rats significantly more cells were foci+ in the AB relative to the AA group (p < 0.05; Tukey), but the percent of neurons with cyto+ labeling did not vary significantly as a function of behavioral condition (p = 0.81; Tukey). In contrast, for the aged rats behavioral condition did not significantly affect the percent of foci+ (p = 0.48; Tukey) or cyto+ (p = 0.63) neurons. Error bars represent +/− standard error of the mean and asterisks indicate statistical significance
Figure 8
Figure 8. With epoch activity and ensemble overlap in young and aged rats
(A) The percent of active neurons (Y-axis) during epoch 1 (grey; cyto+ and both+) and epoch 2 (white; foci+ and both+) for the different age groups and behavioral conditions (X-axis). The AB group showed a significantly larger difference in the proportion of active cells between epochs 1 and 2 compared to the AA group (p < 0.01; Tukey). (B) The Y-axis shows the similarity scores of area 36 (dark purple) and area 35 (light purple) for the different age groups and object exploration conditions (X-axis). There was no significant effect of behavioral condition (F[1,40] = 2.14, p = 0.15), or region (F[1,40] = 0.01, p = 0.96) on similarity score. The similarity score was significantly reduced in the aged compared to the young rats, however (F[1,40] = 19.10, p < 0.001). Error bars represent +/− standard error of the mean and asterisks indicate statistical significance
Figure 9
Figure 9. Object exploration andArcexpression
(A) The Y-axis shows the percent of Arc positive neurons as a function of total object exploration time (X-axis) during epoch 1 (squares) and epoch 2 (triangles) for young (dark) and aged (light) rats. There was not a significant correlation between exploration time and the mean proportion of neurons expressing Arc in either the young (r[23] = 0.11, p = 0.59) or the aged rats (r[23] = 0.23, p = 0.26). (B) The Y-axis shows the similarity score plotted against the reduction in object exploration time between epochs 1 and 2 for the young (dark) and aged rats (light). Similarity score was not significantly correlated with the difference in object exploration time between epochs in either the young (r[12] = −0.05, p = 0.86), or the aged rats (r[12] = −0.21, p = 0.48).
Figure 10
Figure 10. Population coding in the PRC
The capacity of a hypothetical network to represent distinct stimuli based on the degree to which the population code is distributed. The X-axis is the number of neurons (r) in a set of n neurons. Network capacity is maximal when half of the neurons are activated by a given stimulus. In the PRC cortex fewer neurons are activated by a stimulus set in aged (purple) compared to young (green) rats. This could have the result of decreasing the capacity of the aged PRC to represent different stimuli distinctively.

Similar articles

Cited by

References

    1. Aggleton JP, Kyd RJ, Bilkey DK. When is the perirhinal cortex necessary for the performance of spatial memory tasks? Neurosci Biobehav Rev. 2004;28(6):611–24. - PubMed
    1. Barnes CA, Rao G, McNaughton BL. Functional integrity of NMDA-dependent LTP induction mechanisms across the lifespan of F-344 rats. Learn Mem. 1996;3(2-3):124–37. - PubMed
    1. Barnes CA, Suster MS, Shen J, McNaughton BL. Multistability of cognitive maps in the hippocampus of old rats. Nature. 1997;388(6639):272–5. - PubMed
    1. Bartko SJ, Winters BD, Cowell RA, Saksida LM, Bussey TJ. Perceptual functions of perirhinal cortex in rats: zero-delay object recognition and simultaneous oddity discriminations. J Neurosci. 2007;27(10):2548–59. - PMC - PubMed
    1. Brown MW, Aggleton JP. Recognition memory: what are the roles of the perirhinal cortex and hippocampus? Nat Rev Neurosci. 2001;2(1):51–61. - PubMed

Publication types