

A quantitative measure of handgrip myotonia in non-dystrophic myotonia
- PMID: 22987687
- PMCID: PMC3564214
- DOI: 10.1002/mus.23402
A quantitative measure of handgrip myotonia in non-dystrophic myotonia
Abstract
Introduction: Non-dystrophic myotonia (NDM) is characterized by myotonia without muscle wasting. A standardized quantitative myotonia assessment (QMA) is important for clinical trials.
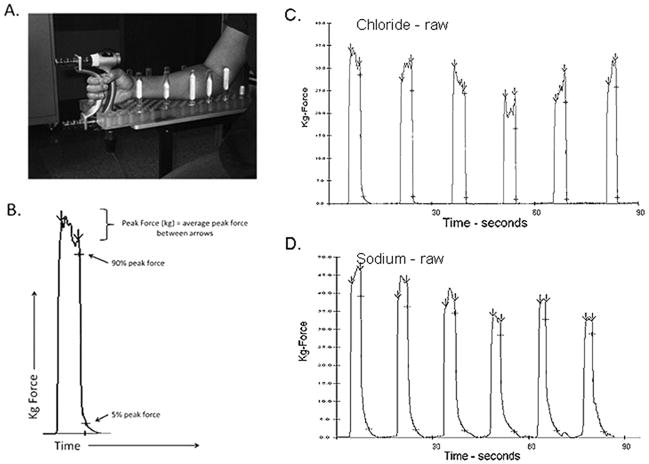
Methods: Myotonia was assessed in 91 individuals enrolled in a natural history study using a commercially available computerized handgrip myometer and automated software. Average peak force and 90% to 5% relaxation times were compared with historical normal controls studied with identical methods.
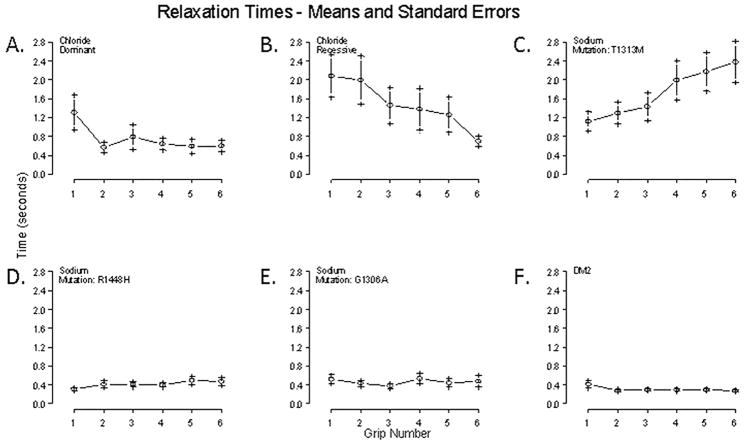
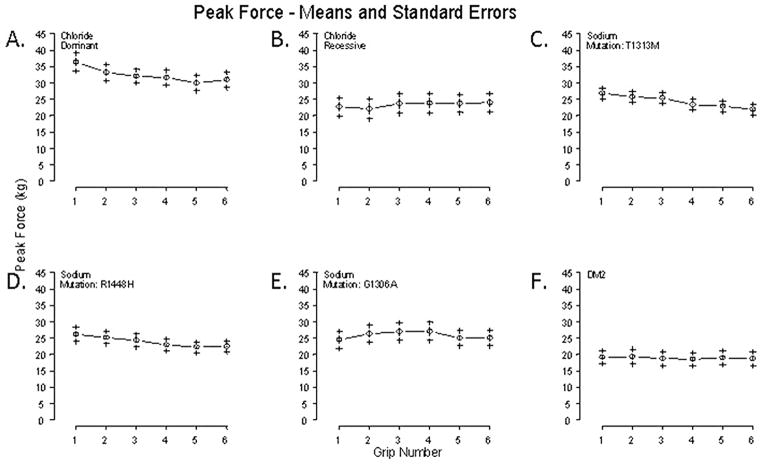
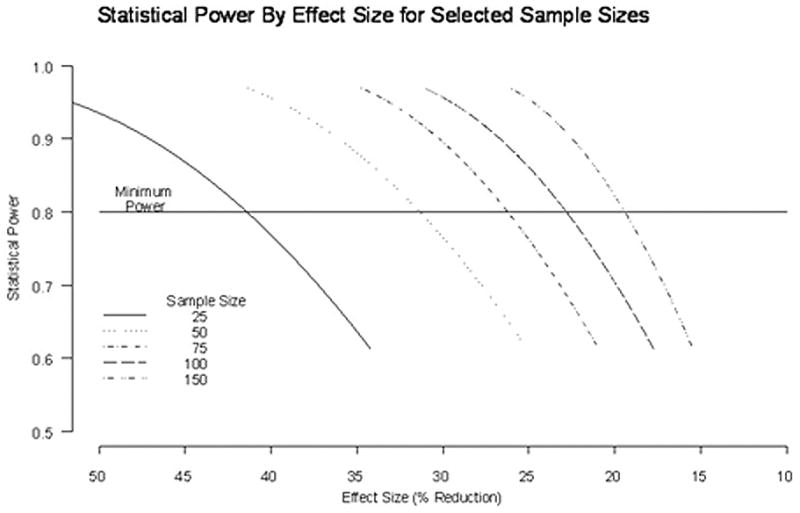
Results: Thirty subjects had chloride channel mutations, 31 had sodium channel mutations, 6 had DM2 mutations, and 24 had no identified mutation. Chloride channel mutations were associated with prolonged first handgrip relaxation times and warm-up on subsequent handgrips. Sodium channel mutations were associated with prolonged first handgrip relaxation times and paradoxical myotonia or warm-up, depending on underlying mutations. DM2 subjects had normal relaxation times but decreased peak force. Sample size estimates are provided for clinical trial planning.
Conclusion: QMA is an automated, non-invasive technique for evaluating myotonia in NDM.
Copyright © 2012 Wiley Periodicals, Inc.
Figures
Similar articles
-
Non-dystrophic myotonia: prospective study of objective and patient reported outcomes.Brain. 2013 Jul;136(Pt 7):2189-200. doi: 10.1093/brain/awt133. Epub 2013 Jun 13. Brain. 2013. PMID: 23771340 Free PMC article.
-
Clinical, electrophysiologic, and genetic study of non-dystrophic myotonia in French-Canadians.Neuromuscul Disord. 2009 May;19(5):330-4. doi: 10.1016/j.nmd.2008.01.007. Epub 2008 Mar 11. Neuromuscul Disord. 2009. PMID: 18337100
-
Quantitative myotonia assessment: an experimental protocol.Neurol Sci. 2000;21(5 Suppl):S971-4. doi: 10.1007/s100720070012. Neurol Sci. 2000. PMID: 11382198 Review.
-
Advances in assessing myotonia: Can sensor-engineered glove have a role?J Neurol Sci. 2017 Apr 15;375:3-7. doi: 10.1016/j.jns.2017.01.038. Epub 2017 Jan 12. J Neurol Sci. 2017. PMID: 28320154
-
The skeletal muscle sodium and chloride channel diseases.Brain. 1995 Apr;118 ( Pt 2):547-63. doi: 10.1093/brain/118.2.547. Brain. 1995. PMID: 7735894 Review.
Cited by
-
Non-dystrophic myotonia: 2-year clinical and patient reported outcomes.Muscle Nerve. 2022 Aug;66(2):148-158. doi: 10.1002/mus.27649. Epub 2022 Jun 16. Muscle Nerve. 2022. PMID: 35644941 Free PMC article.
-
Muscle Ultrasound Shear Wave Elastography as a Non-Invasive Biomarker in Myotonia.Diagnostics (Basel). 2021 Jan 23;11(2):163. doi: 10.3390/diagnostics11020163. Diagnostics (Basel). 2021. PMID: 33498617 Free PMC article.
-
Validation of Motor Outcome Measures in Myotonic Dystrophy Type 2.Front Neurol. 2020 Apr 21;11:306. doi: 10.3389/fneur.2020.00306. eCollection 2020. Front Neurol. 2020. PMID: 32373059 Free PMC article.
-
Non-dystrophic myotonia: prospective study of objective and patient reported outcomes.Brain. 2013 Jul;136(Pt 7):2189-200. doi: 10.1093/brain/awt133. Epub 2013 Jun 13. Brain. 2013. PMID: 23771340 Free PMC article.
-
Safety, Pharmacokinetics, and Pharmacodynamics of a First-in-Class ClC-1 Inhibitor to Enhance Muscle Excitability: Phase I Randomized Controlled Trial.Clin Pharmacol Ther. 2025 Mar;117(3):768-778. doi: 10.1002/cpt.3516. Epub 2024 Dec 9. Clin Pharmacol Ther. 2025. PMID: 39651850 Free PMC article. Clinical Trial.
References
-
- Ebers GC, George AL, Barchi RL, Ting-Passador SS, Kallen RG, Lathrop GM, Beckmann JS, Hahn AF, Brown WF, Campbell RD, et al. Paramyotonia congenita and hyperkalemic periodic paralysis are linked to the adult muscle sodium channel gene. Ann Neurol. 1991;30(6):810–816. - PubMed
-
- Fontaine B, Khurana TS, Hoffman EP, Bruns GA, Haines JL, Trofatter JA, Hanson MP, Rich J, McFarlane H, Yasek DM, et al. Hyperkalemic periodic paralysis and the adult muscle sodium channel alpha-subunit gene. Science. 1990;250(4983):1000–1002. - PubMed
-
- George AL, Jr, Crackower MA, Abdalla JA, Hudson AJ, Ebers GC. Molecular basis of Thomsen’s disease (autosomal dominant myotonia congenita) Nat Genet. 1993;3(4):305–310. - PubMed
-
- Koch MC, Steinmeyer K, Lorenz C, Ricker K, Wolf F, Otto M, Zoll B, Lehmann-Horn F, Grzeschik KH, Jentsch TJ. The skeletal muscle chloride channel in dominant and recessive human myotonia. Science. 1992;257(5071):797–800. - PubMed
Publication types
MeSH terms
Substances
Supplementary concepts
Grants and funding
LinkOut - more resources
Full Text Sources
