Review
. 2012 Oct;36(4):757-74.
doi: 10.1002/jmri.23597.

Review of MR elastography applications and recent developments

Affiliations
Review

Review of MR elastography applications and recent developments

Kevin J Glaser et al. J Magn Reson Imaging. 2012 Oct.

Abstract

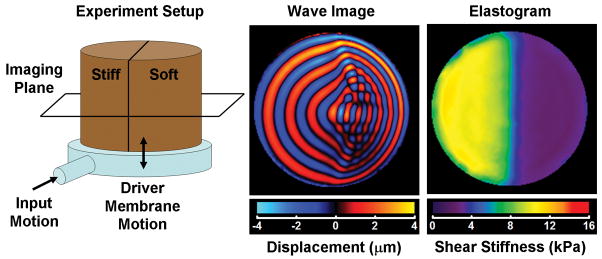
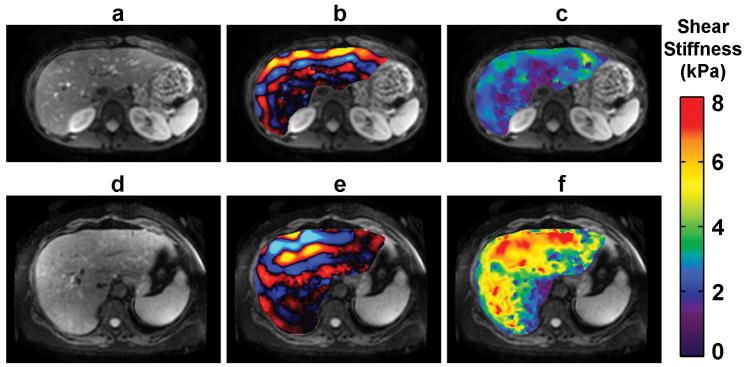
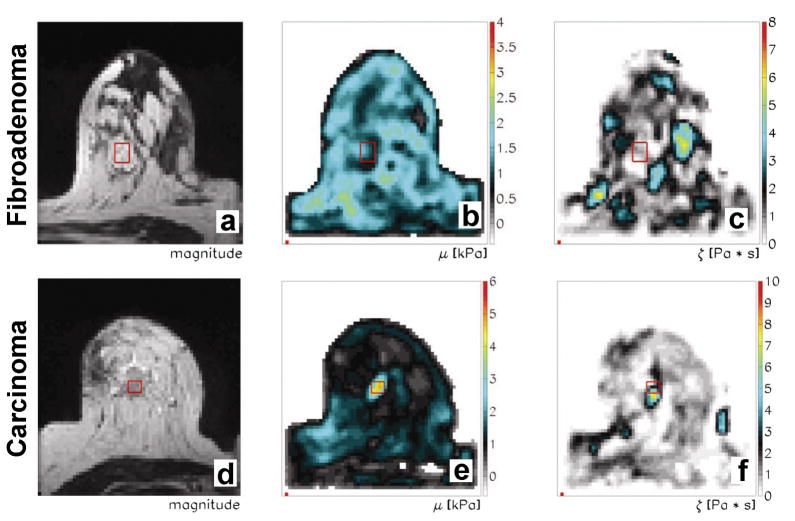
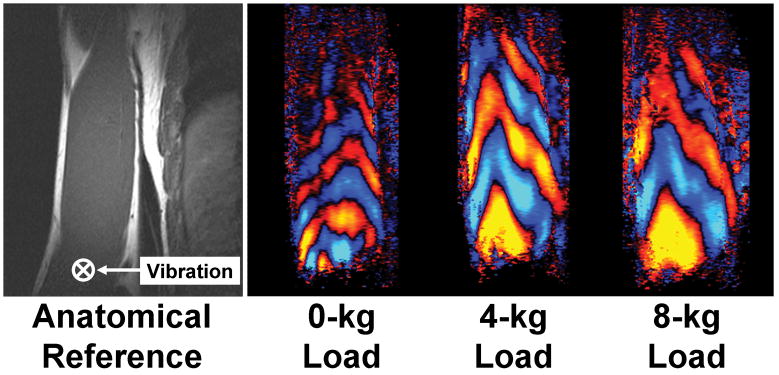
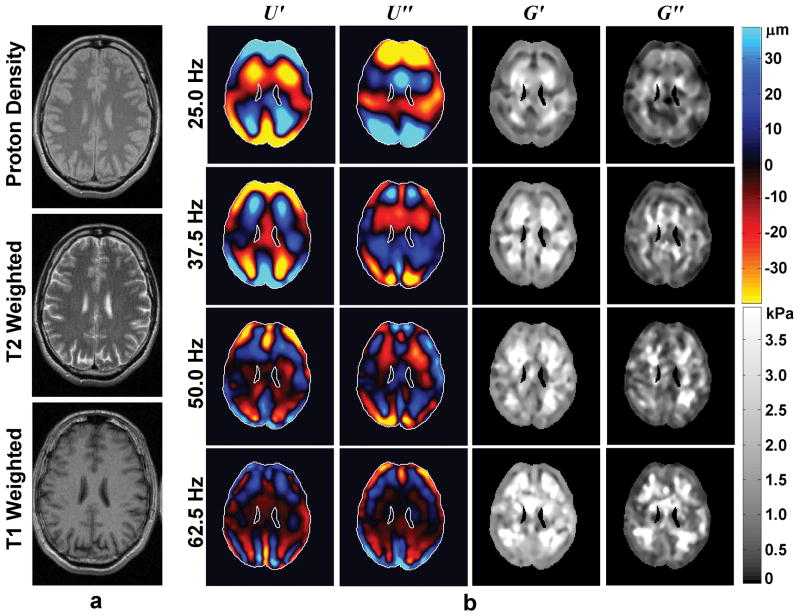
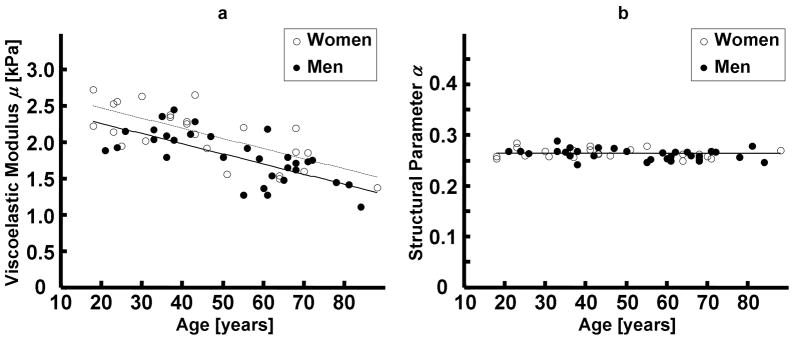
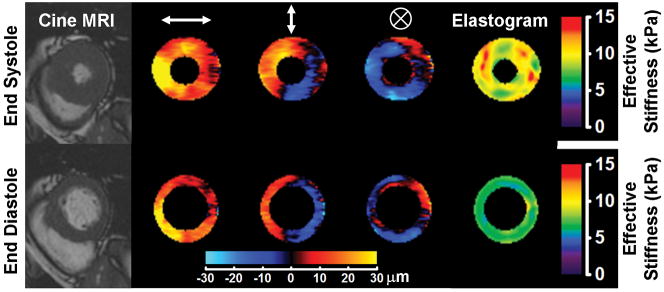
The technique of MR elastography (MRE) has emerged as a useful modality for quantitatively imaging the mechanical properties of soft tissues in vivo. Recently, MRE has been introduced as a clinical tool for evaluating chronic liver disease, but many other potential applications are being explored. These applications include measuring tissue changes associated with diseases of the liver, breast, brain, heart, and skeletal muscle including both focal lesions (e.g., hepatic, breast, and brain tumors) and diffuse diseases (e.g., fibrosis and multiple sclerosis). The purpose of this review article is to summarize some of the recent developments of MRE and to highlight some emerging applications.


Figures

Figure 1
Figure 1
The diagram on the left depicts an MRE experiment performed on a 2-layer bovine gelatin phantom made of a stiff gel and a soft gel. The phantom rests on a plastic drum driver supplied with time-harmonic pressure variations that flex the membrane of the driver. As the phantom shakes up and down, shear waves are produced at the edge of the phantom (due to inertial effects) that propagate into the phantom. The phantom was imaged in the coronal imaging plane. The middle image shows a wave image from an MRE acquisition performed with motion encoding in the through-plane direction. The difference in the shear wavelength in the two regions is evident with the wavelength being longer in the stiff region. The image on the right is an elastogram of the phantom indicating the stiff and soft regions.
Figure 2
Figure 2
MRE pulse sequence diagrams are shown depicting the RF pulses; gradients in the frequency-encoding, phase-encoding, and slice-select directions; and the applied motion (RF, Gx, Gy, Gz, and M, respectively). On the left is a GRE MRE sequence for imaging 60-Hz mechanical motion using a 16.7-ms gradient-moment-nulled (GMN) motion-encoding gradient (MEG) applied along Gz. On the right is a SE-EPI MRE sequence for imaging 60-Hz motion using 2 bipolar 6.5-ms MEG, 1 on each side of the refocusing pulse and synchronized to the motion. Both sequences are shown with GMN imaging gradients and spatial presaturation pulses.
Figure 3
Figure 3
Hepatic MRE exams of a 28-year-old healthy female volunteer with no known liver disease (top row) and a 66-year-old female with steatohepatitis with bridging fibrosis, early cirrhosis grade 3–4, and stage-2 inflammation (bottom row). Anatomical reference images are shown in (a) and (d), MRE wave images are shown in (b) and (e), and the MRE elastograms are shown in (c) and (f). The fibrotic liver can be seen to be significantly stiffer than the healthy liver. (Courtesy of Dr. Meng Yin, Mayo Clinic, Rochester, MN.)
Figure 4
Figure 4
Breast MRE images from exams performed on patients with a fibroadenoma (top row) and an invasive carcinoma (bottom row). The acquisitions were performed using 65-Hz vibrations applied to the lateral side of the breast. MR magnitude images from the MRE acquisition are shown in the first column, while shear stiffness and viscosity images from the MRE reconstruction are shown in the second and third columns, respectively. (From Xydeas T, Siegmann K, Sinkus R, Krainick-Strobel U, Miller S, Claussen CD. Magnetic resonance elastography of the breast: correlation of signal intensity data with viscoelastic properties. Invest Radiol 2005;40(7):412–420, adapted with permission.)
Figure 5
Figure 5
MRE investigation of stiffness changes in the loaded and unloaded biceps brachii. The MRE acquisition of the right arm was performed on a healthy male subject lying in the right lateral decubitus position as described in Dresner et al. (135). The subject was imaged in a coronal plane while supporting different amounts of weight. The image on the left is a reference image indicating the orientation of the muscle and the location of the driver, which was placed above the distal biceps tendon and vibrated in the through-plane direction. The three images on the right show wave images from the MRE acquisitions performed with the subject holding 0-, 4-, and 8-kg loads. The shear wavelength in the muscle can be seen to increase with the increasing muscle load, indicating that the stiffness of the muscle has significantly increased. (Courtesy of Dr. Yogesh Mariappan, Mayo Clinic, Rochester, MN.)
Figure 6
Figure 6
Example of brain MRE performed on a 47-year-old healthy male volunteer. (a) Proton-density-weighted, T2-weighted, and T1-weighted anatomical MR images. (b) Wave images and elastograms for data corresponding to several frequencies of mechanical vibration ranging from 25 Hz (top row) to 62.5 Hz (bottom row). The first two columns show the real and imaginary parts of the wave data obtained at each frequency, and the last two columns show the real and imaginary parts of the reconstructed shear moduli at each frequency. (From Sack I, Beierbach B, Wuerfel J, et al. The impact of aging and gender on brain viscoelasticity. Neuroimage 2009;46(3):652–657, adapted with permission.)
Figure 7
Figure 7
Changes in brain tissue mechanical properties with age and gender in an MRE study of 55 healthy subjects (23 females, 32 males). (a) The viscoelastic modulus obtained from a spring-pot model of multifrequency MRE data shows a decline in brain tissue stiffness at about 0.8% per year with female brain stiffness being slightly higher than the age-matched male subjects. (b) The structural parameter derived from the spring-pot model does not appear to vary with age or sex. (From Sack I, Beierbach B, Wuerfel J, et al. The impact of aging and gender on brain viscoelasticity. Neuroimage 2009;46(3):652–657, adapted with permission.)
Figure 8
Figure 8
Cardiac MRE performed in a healthy volunteer as described in Kolipaka et al. (207). The subject was imaged in the supine position with 80-Hz vibrations induced in the heart via a pneumatic driver system placed against the chest wall anterior to the heart. Measurements were performed of the short axis of the left ventricle at the end of systole and the end of diastole. The left column shows MR images from a cine acquisition showing the anatomy of the left ventricle at these phases of the cardiac cycle. Columns 2, 3, and 4 show masked wave images of the horizontal, vertical, and though-plane components of the motion, respectively, produced in the heart. Column 5 shows the elastograms produced from the wave data. The cardiac tissue can be seen to be significantly stiffer at the end of systole than at the end of diastole. (Courtesy of Dr. Arunark Kolipaka, The Ohio State University Medical Center, Columbus, OH.)
Figure 9
Figure 9
Cardiac MRE performed in vivo in a normal pig as described in Kolipaka et al. (208). The pig was imaged in the supine position with a pneumatic drum driver operating at 80 Hz placed above the heart. Data were acquired in a short axis view of the left ventricle while simultaneous measurements of the left ventricular pressure were made. Volume measurements of the left ventricle were performed using separate multislice cine bSSFP acquisitions of the heart. The figure shows the stiffness, pressure, and volume measurements indicating that the measured stiffness correlates well with the changes in ventricular pressure during the cardiac cycle and suggesting that noninvasive stiffness-volume curves obtained with MRE may provide similar information about cardiac function as invasive pressure-volume measurements. (Courtesy of Dr. Arunark Kolipaka, The Ohio State University Medical Center, Columbus, OH.)

Similar articles

Cited by

References

    1. American Cancer Society. Cancer facts & figures. Atlanta, GA: American Cancer Society, Inc; 2008. p. 70.
    1. Fatemi M, Manduca A, Greenleaf JF. Imaging elastic properties of biological tissues by low-frequency harmonic vibration. Proc IEEE. 2003;91:1503–1519.
    1. Greenleaf JF, Fatemi M, Insana M. Selected methods for imaging elastic properties of biological tissues. Annu Rev Biomed Eng. 2003;5:57–78. - PubMed
    1. Parker KJ, Doyley MM, Rubens DJ. Imaging the elastic properties of tissue: the 20 year perspective. Phys Med Biol. 2011;56:R1–R29. - PubMed
    1. Chenevert TL, Skovoroda AR, O’Donnell M, Emelianov SY. Elasticity reconstructive imaging by means of stimulated echo MRI. Magnet Reson Med. 1998;39:482–490. - PubMed

Publication types

MeSH terms