. 2012 Oct 2;109(40):16173-8.
doi: 10.1073/pnas.1204799109. Epub 2012 Sep 17.

Complexity of chromatin folding is captured by the strings and binders switch model

Affiliations

Complexity of chromatin folding is captured by the strings and binders switch model

Mariano Barbieri et al. Proc Natl Acad Sci U S A. .

Abstract

Chromatin has a complex spatial organization in the cell nucleus that serves vital functional purposes. A variety of chromatin folding conformations has been detected by single-cell imaging and chromosome conformation capture-based approaches. However, a unified quantitative framework describing spatial chromatin organization is still lacking. Here, we explore the "strings and binders switch" model to explain the origin and variety of chromatin behaviors that coexist and dynamically change within living cells. This simple polymer model recapitulates the scaling properties of chromatin folding reported experimentally in different cellular systems, the fractal state of chromatin, the processes of domain formation, and looping out. Additionally, the strings and binders switch model reproduces the recently proposed "fractal-globule" model, but only as one of many possible transient conformations.


Conflict of interest statement

The authors declare no conflict of interest.

Figures

Fig. 1.
Fig. 1.
The emerging stable states of the SBS model and the mechanisms of its self-organization. (A) Schematic representation of the SBS model. A chromatin filament is represented by a SAW polymer comprising n beads randomly floating within an assigned volume. A fraction, f, of beads (binding sites) can interact with Brownian molecules (magenta spheres; binders) with concentration cm and binding site affinity EX. In this example, f = 0.5 for an equal number of blue (binding) and grey (nonbinding) sites. Molecules bind more than one polymer site, allowing for loop formation. (B) Three classes of states exist. The phase diagram illustrates the conformational state of the system as a function of two main control parameters, cm and EX. The system is in an open randomly folded conformation below the transition line, Ctr(EX) (dashed curve), it folds in a compact conformation above it, and it takes a different fractal structure at the transition point. (C) The polymer mean-square distance. R2(s) is the mean-square distance (in units of the bead linear length d0) of two polymer sites having a contour distance s. R2 is shown as a function of s for three values of the binder concentration, cm = 5, 10.4, and 25 nmol/L, corresponding to below, around, and above the transition point (here, EX = 2 kBT). At large s, R2(s) has a power-law behavior R2(s) ∼ s2v; at cm = 10.4 nmol/L we find ν ∼ 0.39. For s/s0 > 400, finite size effects are seen. (D) The power law exponent of R2(s) has three regimes. The exponent, ν, has a sigmoid behavior as a function of cm, corresponding to different system states, with ν ∼ 0.58 for cm < Ctr; ν ∼ 0.5 at Ctr = 10.0 nmol/L; and ν ∼ 0.0 at cm > Ctr. (E) Site contact probability. Pc(s) is the contact probability of two sites with contour distance s along the polymer chain. It is plotted for cm = 5, 10.4, and 25 nmol/L. At large s, a power law is found: Pc(s) ∼ 1/sα. We find α = 1.1 at cm = 10.4 nmol/L. (F) Power law behavior of Pc(s). The Pc(s) exponent α expressed as a function of cm also displays three regimes: below, around, and above Ctr.
Fig. 2.
Fig. 2.
The SBS model explains the range of experimental chromatin folding behaviors. (A) Mean-square distance of subchromosomal regions from FISH data. Mean-square distance, R2(s), from FISH data in pro-B cells chromosome 12, spanning 3 Mb (10). Superimposed dashed line indicates behavior predicted by the FG model; continuous line indicates behavior predicted by the SBS model in the compact state. (BD) Contact probability from Hi-C data and SBS model. (B) Contact probability, Pc(s), was calculated separately for different chromosomes from published Hi-C dataset in human lymphoblastoid cell line GM06990 (13). Chromosomes 11 and 12 follow the average behavior reported (13) in the 0.5–7 Mb region (shaded in grey), with exponent α of approximately 1.08. Chromosomes X and 19 deviate from the average, with α exponents of approximately 0.93 to approximately 1.30, respectively. In a given system, different chromosomes can have different exponents. (C) Pc(s) was calculated for different chromosomes from published Hi-C dataset in human embryonic stem cell line H1–hESC (25). All chromosomes deviate from exponent α of approximately 1.08 in the 0.5–7 Mb region (shaded in grey), and have an exponent α of approximately 1.65, characteristic of open chromatin within the SBS interpretation. Different systems can have different exponents. (D) Mixtures of open and compact SBS polymers can model average Pc(s). Average Pc(s) is shown for mixtures of open and compact polymers in the SBS model (where α = 2.1 and 0.0, respectively). In each mixture, p and 1-p are the fractions of open and compact polymers, respectively. Pc(s) and α depend on p. For p of approximately 60%, α = 1.08 is found in a range of s about one order of magnitude long, as in Hi-C data. Simply changing the fraction of open chromatin can recover the entire range of Hi-C exponents of B and C.
Fig. 3.
Fig. 3.
The SBS model captures the globular conformation of chromatin. (A) Schematic representation of the polymer system used to study formation of chromatin globules or domains. (B) Snapshots of chromatin domains formed after MC simulations of the SBS polymer model represented in A. (C) The steady-state “contact matrix” shows two separate chromatin domains. (D) The average Pc(s) shows two regimes: closed chromatin, at shorter s because of formation of globules; and open chromatin, at larger genomic regions because of the absence of interactions between the two domains.
Fig. 4.
Fig. 4.
The SBS model captures the full range of values of the distance kurtosis observed in FISH data. (A) The ratio of the fourth and second moment of the distance R between loci at the genomic distance s [i.e., the kurtosis; formula image
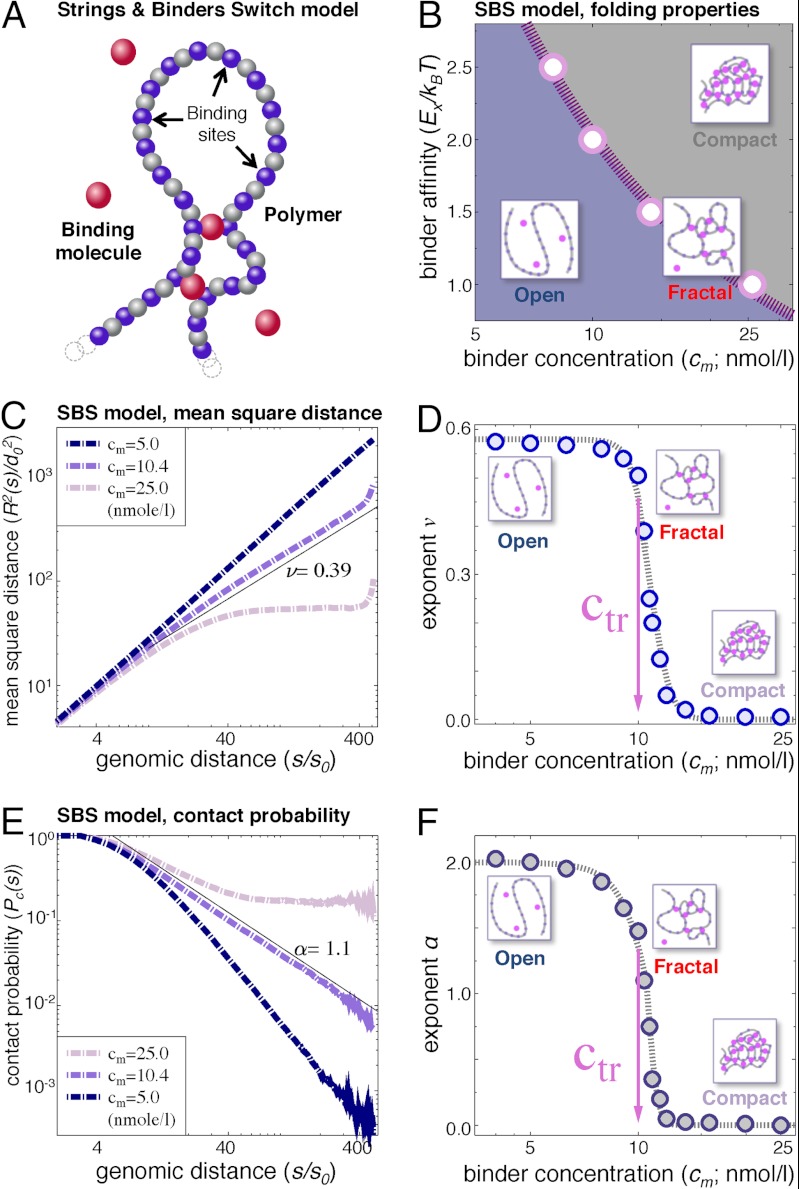
] is plotted as a function of s. It provides a measure of the relative amplitude of fluctuations of the polymer conformations. K = 1.50 when R2(s) is randomly distributed as a self-avoiding polymer (horizontal dashed line). Experimental K values depart from 1.50; K values were first analyzed in ref. , and originate from human fibroblast chromosome 1 ridges or whole chromosomes 1 or 11 (9) (squares, open circles, and filled circles, respectively), and from pre/pro-B or pro-B cell murine immunoglobulin heavy chain locus (10) (light- or dark-blue diamonds, respectively). (B) The kurtosis measured in the SBS model is plotted as a function of cm. K is close to 1.5 at low and high concentrations of binding molecules (open and closed chromatin). Around the binder threshold concentration, K exhibits a peak with values up to approximately 5. The range of values of K measured experimentally (A) matches the range found within the SBS model. It emerges that, beyond open and compact states, chromatin loci are likely to include also fractal conformations corresponding to the transition point.
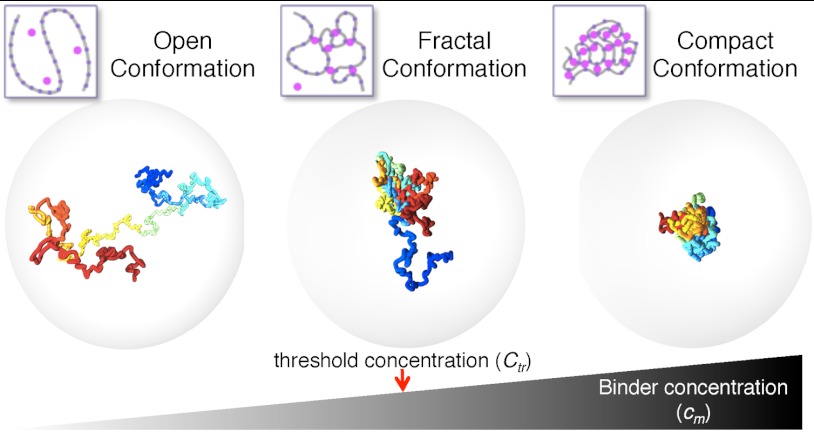
Fig. 5.
Fig. 5.
Overview of the system states and their transitions. Representation of three classes of stable conformational states of the SBS polymer chain shown in Fig. 1: (Left) the open random coil (cm = 5 nmol/L; cm < Ctr), (Center) the transition-point fractal (cm = 10 nmol/L; cm around Ctr), and (Right) the compact globule state (cm = 25 nmol/L; cm > Ctr). The polymer conformations were obtained from MC simulations of the SBS model. For clarity, the polymer binding molecules are not shown and the surrounding transparent sphere represents the nucleus. Polymer and sphere sizes are proportional to the size of mammalian chromosomes and nuclei, respectively. Switch-like conformational changes occur, regulated by increasing cm or EX above precise threshold values marking thermodynamic phase transitions.

References

    1. Lanctot C, Cheutin T, Cremer M, Cavalli G, Cremer T. Dynamic genome architecture in the nuclear space: Regulation of gene expression in three dimensions. Nat Rev Genet. 2007;8:104–115. - PubMed
    1. Misteli T. Beyond the sequence: Cellular organization of genome function. Cell. 2007;128:787–800. - PubMed
    1. Cook PR. The organization of replication and transcription. Science. 1999;284:1790–1795. - PubMed
    1. Woodcock CL, Ghosh RP. Chromatin higher-order structure and dynamics. Cold Spring Harb Perspect Biol. 2010;2:a000596. - PMC - PubMed
    1. Moorman C, et al. Hotspots of transcription factor colocalization in the genome of Drosophila melanogaster. Proc Natl Acad Sci USA. 2006;103:12027–12032. - PMC - PubMed

Publication types

MeSH terms

LinkOut - more resources