

Alternating electron and proton transfer steps in photosynthetic water oxidation
- PMID: 22988080
- PMCID: PMC3479599
- DOI: 10.1073/pnas.1206266109
Alternating electron and proton transfer steps in photosynthetic water oxidation
Abstract
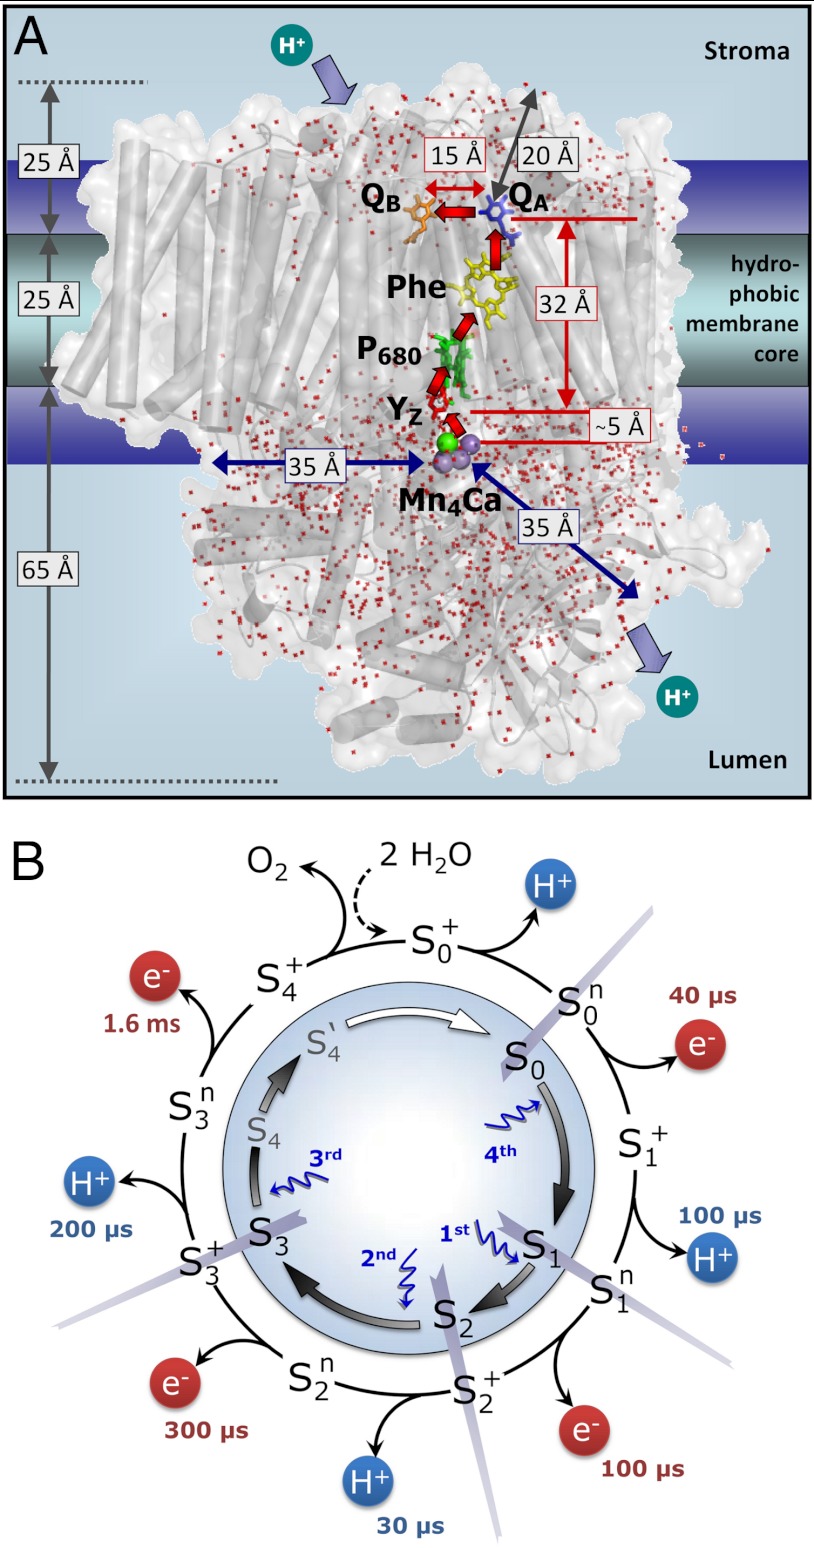
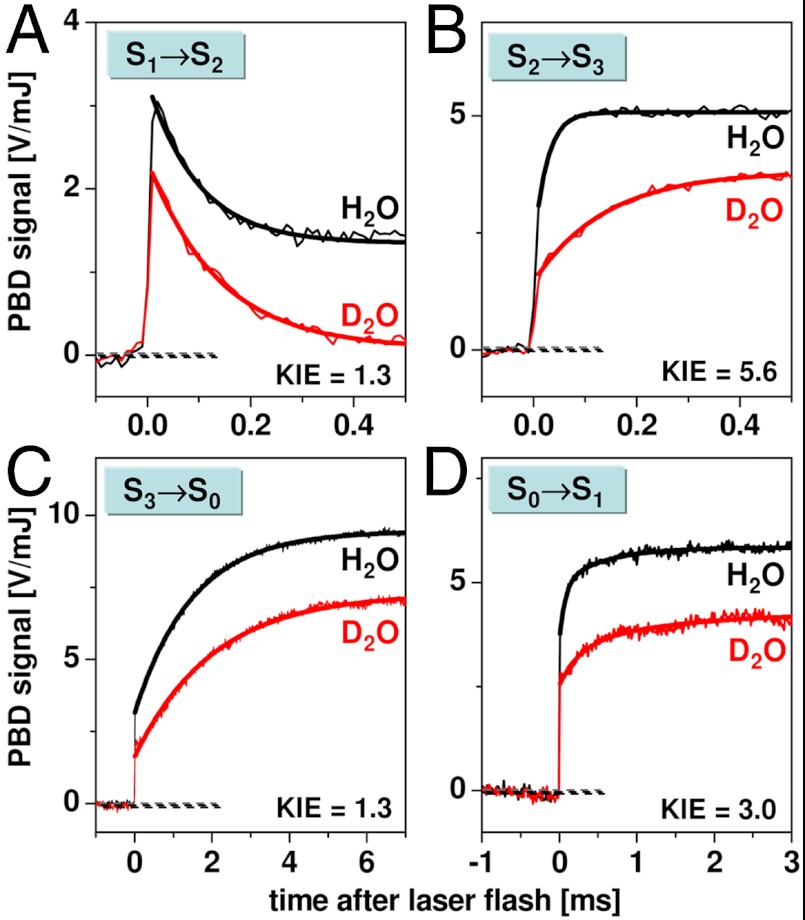
Water oxidation by cyanobacteria, algae, and plants is pivotal in oxygenic photosynthesis, the process that powers life on Earth, and is the paradigm for engineering solar fuel-production systems. Each complete reaction cycle of photosynthetic water oxidation requires the removal of four electrons and four protons from the catalytic site, a manganese-calcium complex and its protein environment in photosystem II. In time-resolved photothermal beam deflection experiments, we monitored apparent volume changes of the photosystem II protein associated with charge creation by light-induced electron transfer (contraction) and charge-compensating proton relocation (expansion). Two previously invisible proton removal steps were detected, thereby filling two gaps in the basic reaction-cycle model of photosynthetic water oxidation. In the S(2) → S(3) transition of the classical S-state cycle, an intermediate is formed by deprotonation clearly before electron transfer to the oxidant (Y Z OX). The rate-determining elementary step (τ, approximately 30 µs at 20 °C) in the long-distance proton relocation toward the protein-water interface is characterized by a high activation energy (E(a) = 0.46 ± 0.05 eV) and strong H/D kinetic isotope effect (approximately 6). The characteristics of a proton transfer step during the S(0) → S(1) transition are similar (τ, approximately 100 µs; E(a) = 0.34 ± 0.08 eV; kinetic isotope effect, approximately 3); however, the proton removal from the Mn complex proceeds after electron transfer to . By discovery of the transient formation of two further intermediate states in the reaction cycle of photosynthetic water oxidation, a temporal sequence of strictly alternating removal of electrons and protons from the catalytic site is established.
Conflict of interest statement
The authors declare no conflict of interest.
Figures
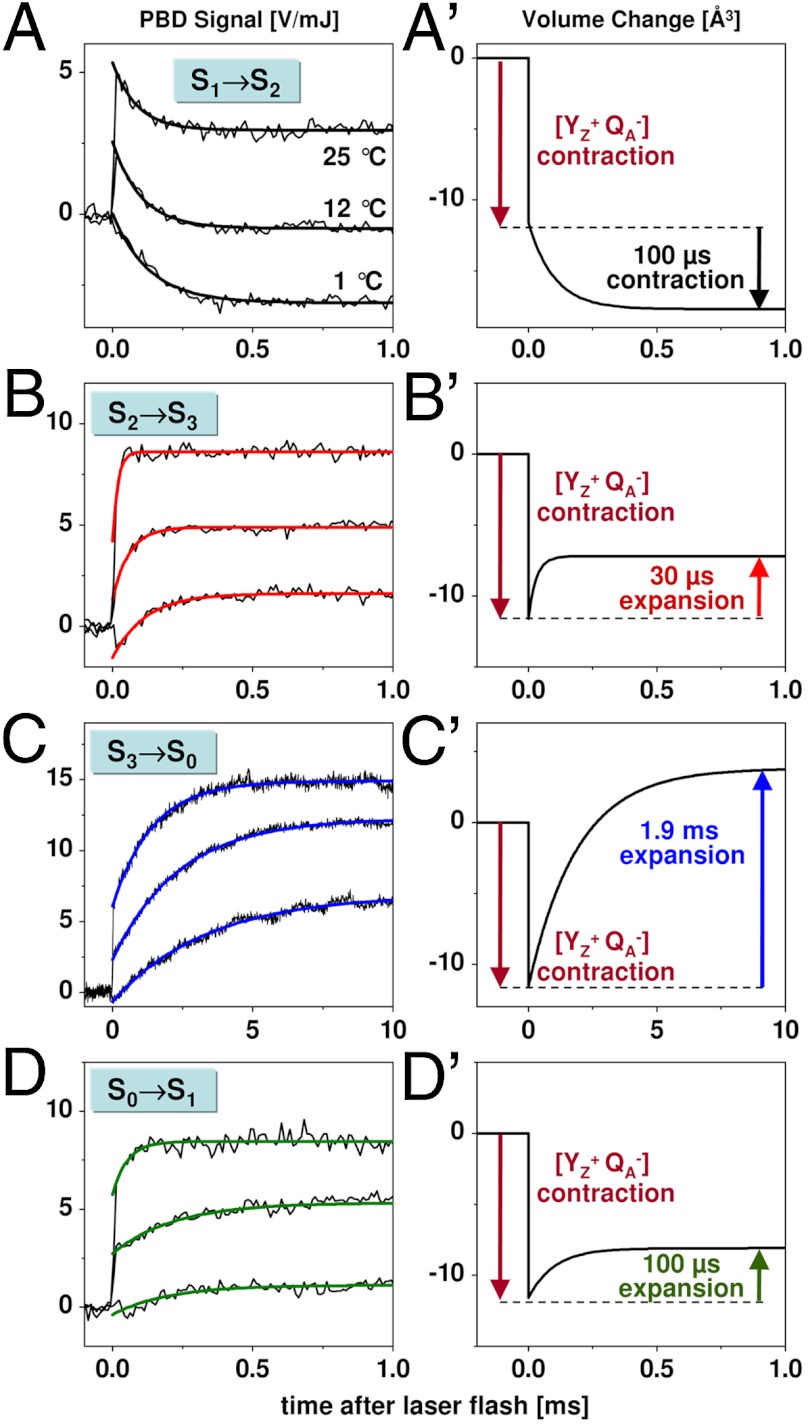
 (C, C′), and S0 → S1 (D, D′). Thin lines, experimental data; thick lines, simulations using a step-shaped function for the rapid jump caused by
  formation and single-exponential functions for the slower signal contributions. (Right) Schematic illustration of volume changes deduced from the analysis of the temperature dependence of the PBD signals (time constants for about 20 °C; see Fig. 3).
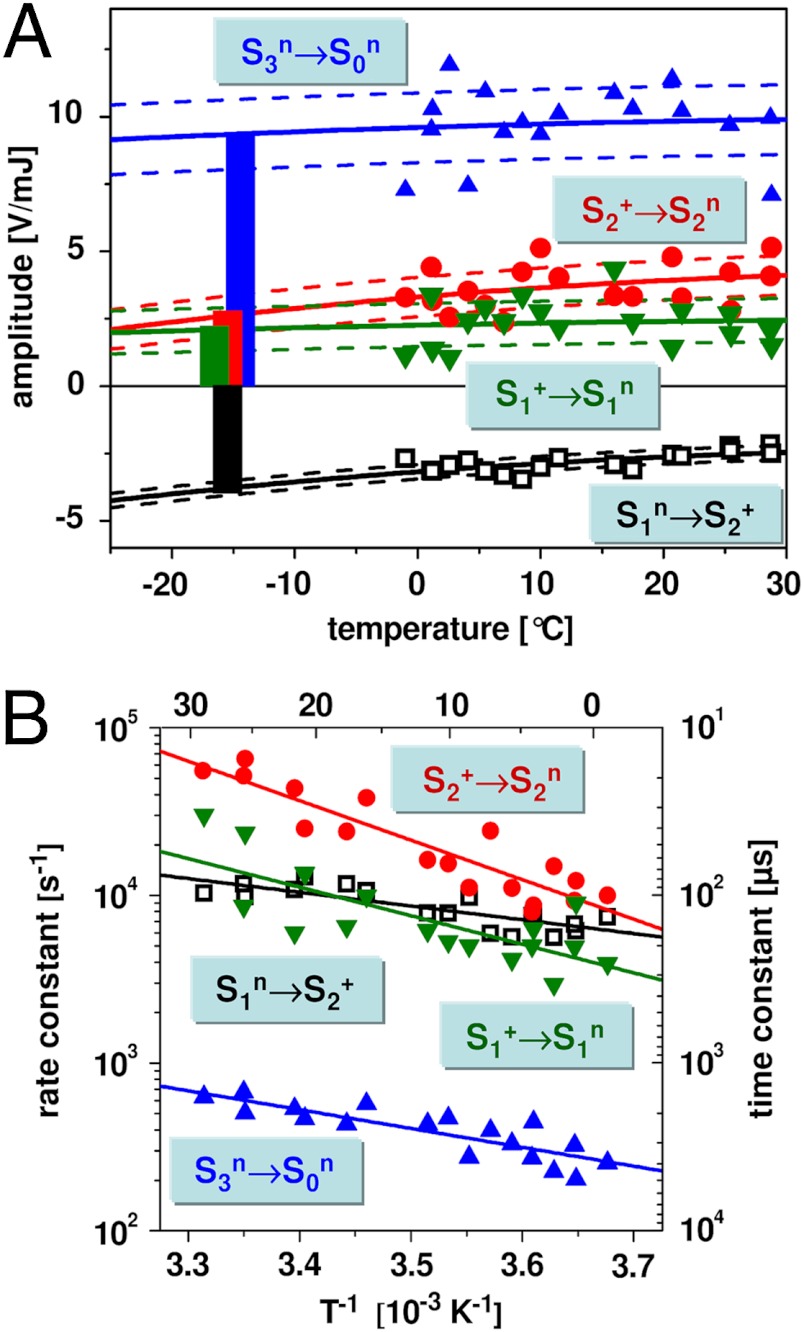
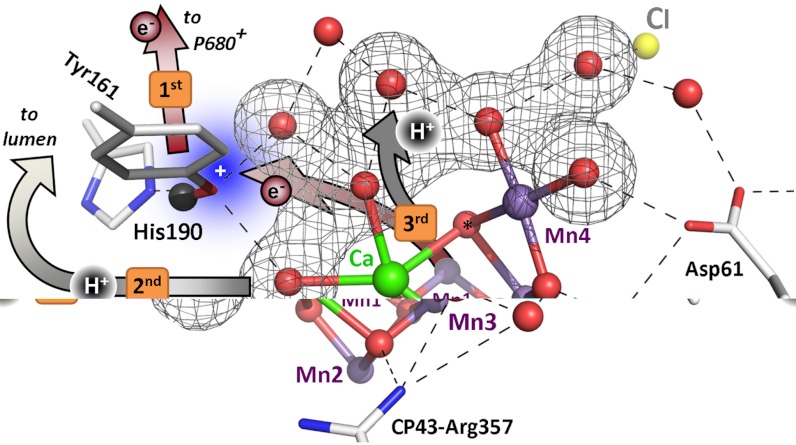
 formation results in a rearrangement of the shown H-bonded network (completed within less than 1 µs), likely involving a shift of the phenolic proton to His190 and lowering of pK values for deprotonation of the water molecules in the outlined cluster (grey mesh). A proton is removed from the Mn complex/YZ environment within about 30 µs, as evidenced by the PBD results presented herein, and a proton vacancy is supposedly created within the outlined water cluster (“2nd”). In the ET to
  (about 300 µs), Mn oxidation is directly coupled to a proton transfer step involving the previously created proton vacancy of the water cluster (concerted electron–proton transfer) (“3rd”).
References
-
- McEvoy JP, Brudvig GW. Water-splitting chemistry of photosystem II. Chem Rev. 2006;106:4455–4483. - PubMed
-
- Dau H, Haumann M. The manganese complex of photosystem II in its reaction cycle: Basic framework and possible realization at the atomic level. Coord Chem Rev. 2008;252:273–295.
-
- Barber J. Photosynthetic energy conversion: Natural and artificial. Chem Soc Rev. 2009;38:185–196. - PubMed
-
- Blankenship RE. Molecular Mechanisms of Photosynthesis. Oxford: Blackwell Science; 2002.
-
- Rutherford AW, Moore TA. Mimicking photosynthesis, but just the best bits. Nature. 2008;453:449. - PubMed
Publication types
MeSH terms
Substances
LinkOut - more resources
Full Text Sources
