. 2012 Oct 9;109(41):E2784-93.
doi: 10.1073/pnas.1202366109. Epub 2012 Sep 17.

Hypoxia-inducible factor-1 alpha-dependent induction of FoxP3 drives regulatory T-cell abundance and function during inflammatory hypoxia of the mucosa

Affiliations

Hypoxia-inducible factor-1 alpha-dependent induction of FoxP3 drives regulatory T-cell abundance and function during inflammatory hypoxia of the mucosa

Eric T Clambey et al. Proc Natl Acad Sci U S A. .

Abstract

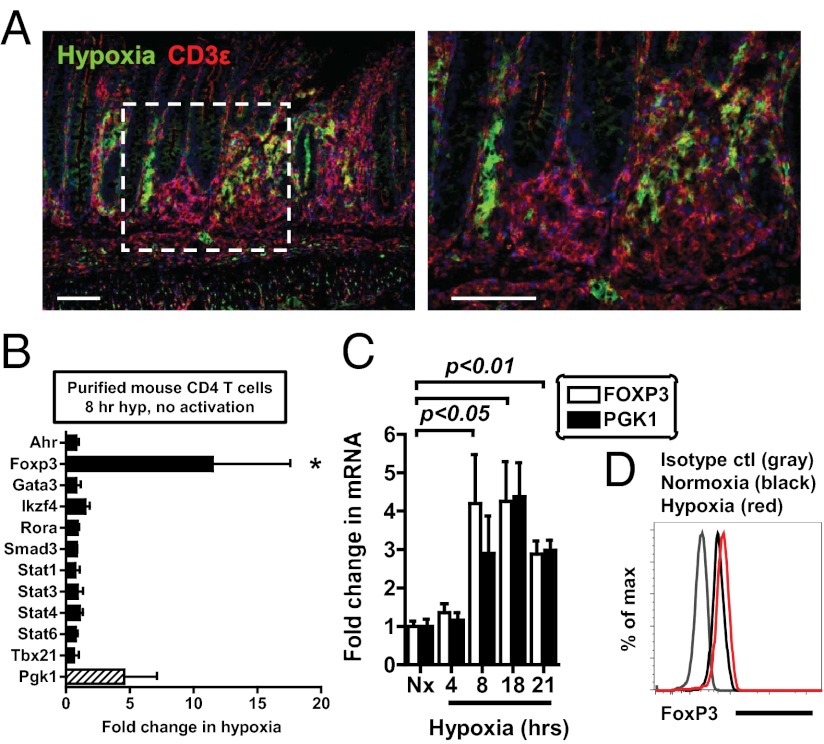
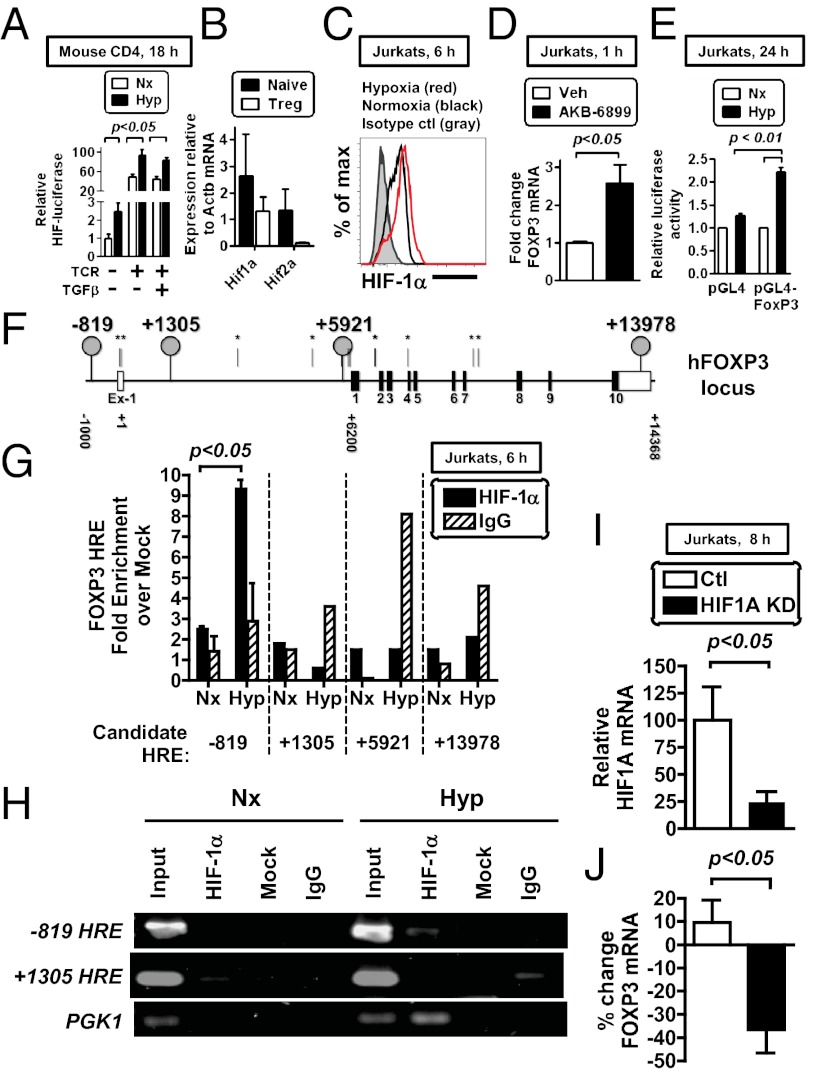
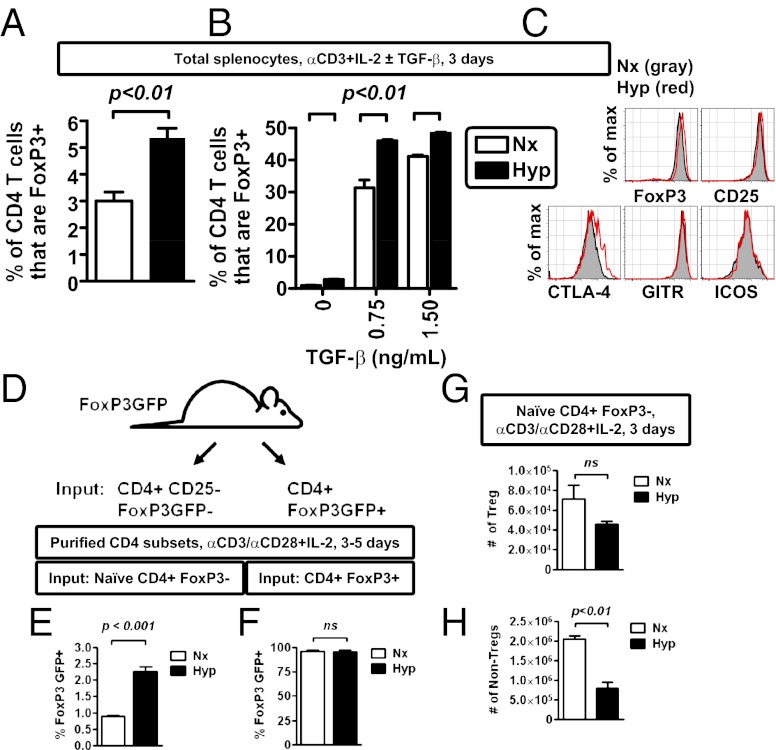
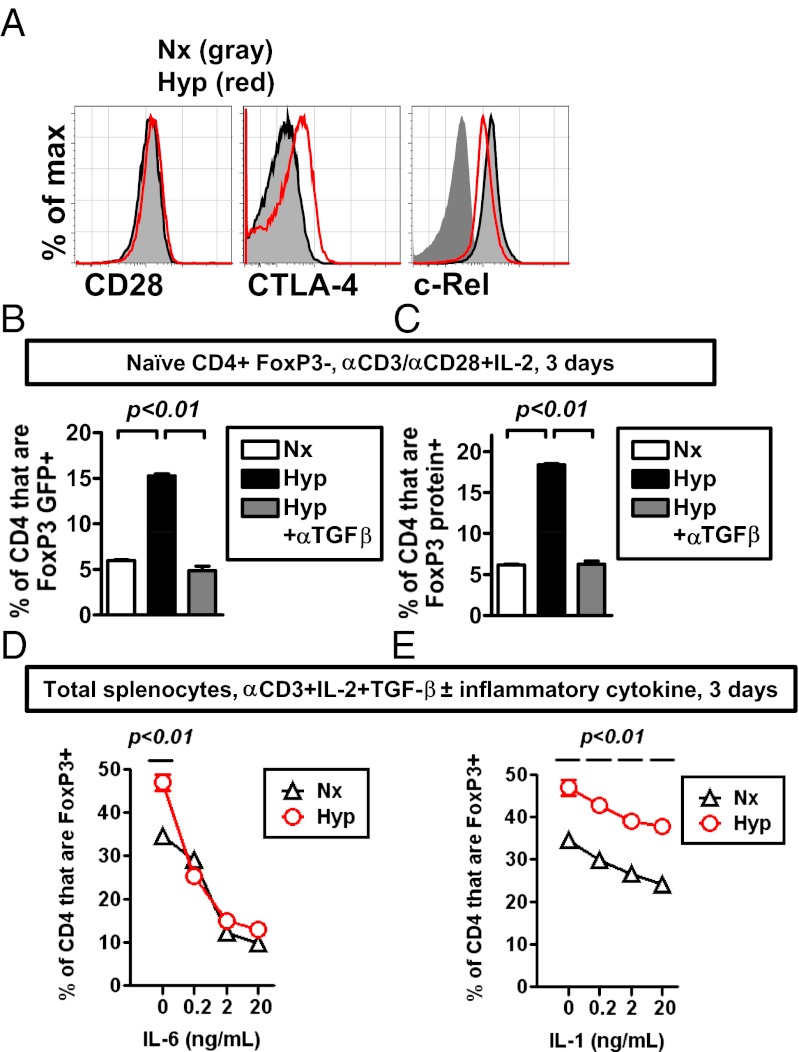
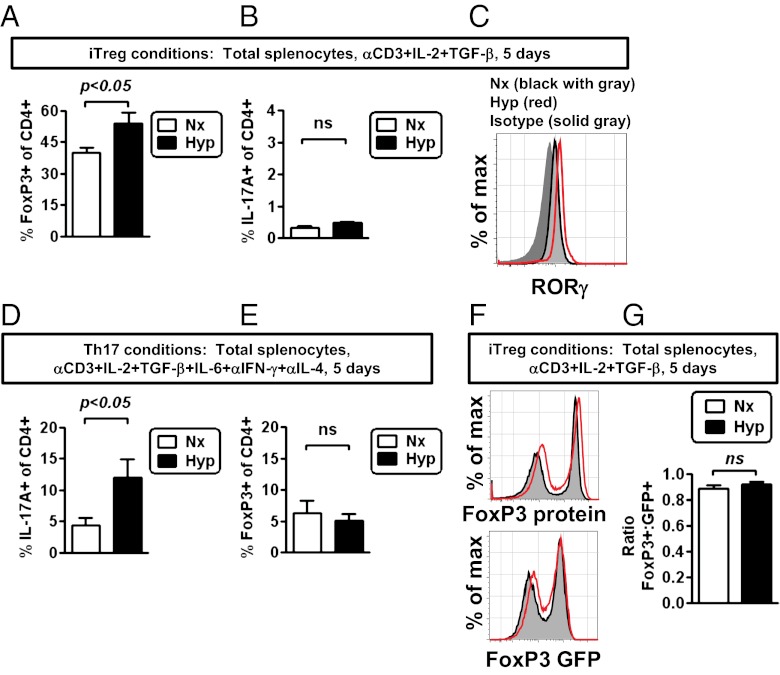
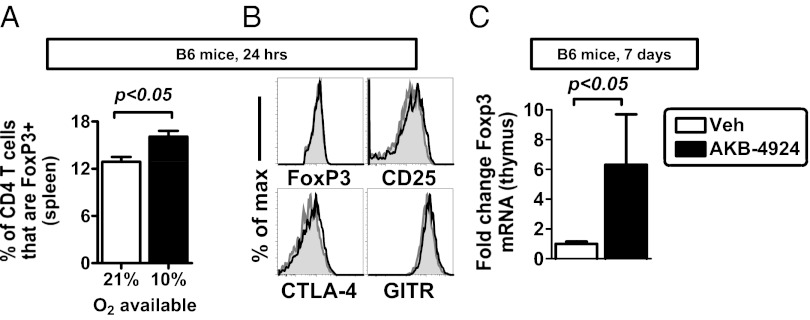
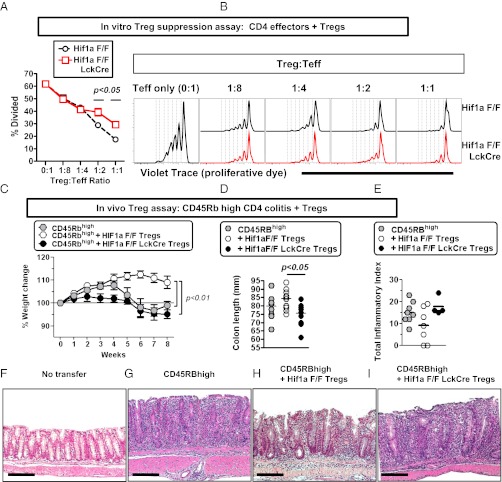
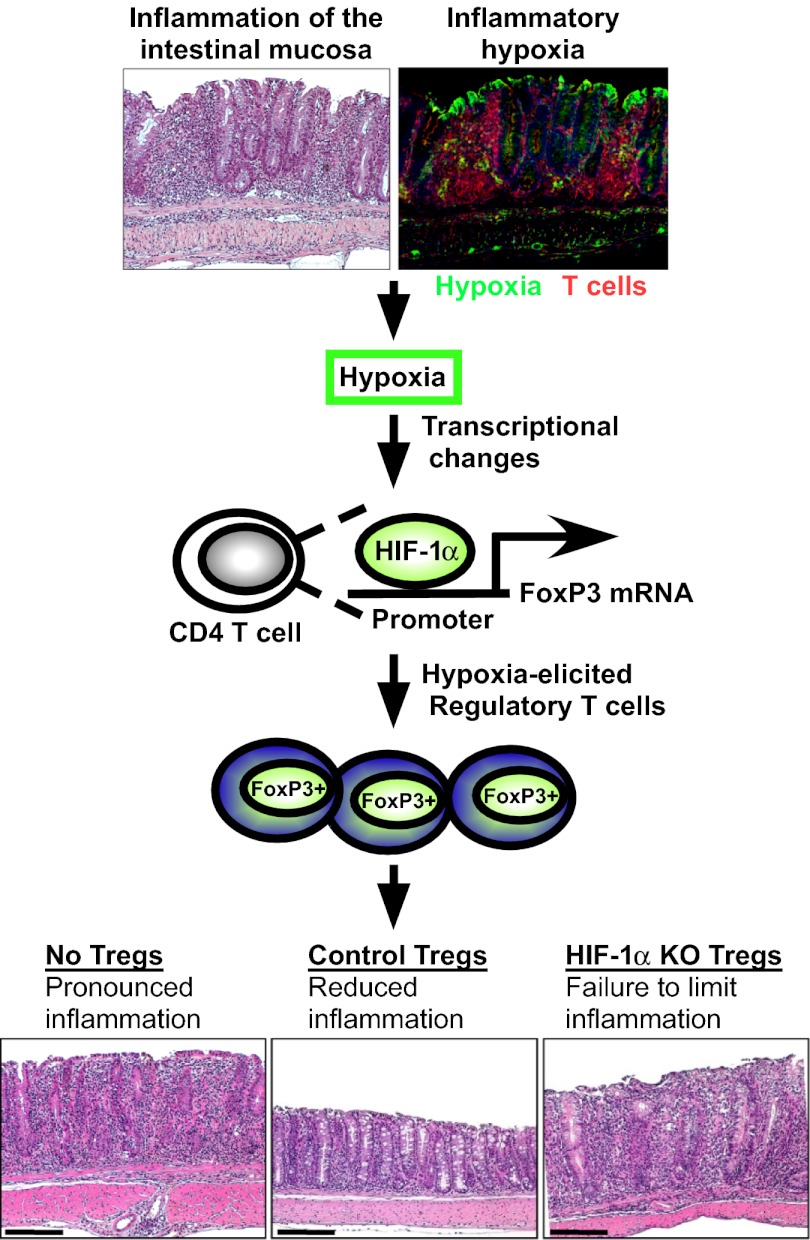
Recent studies have demonstrated dramatic shifts in metabolic supply-and-demand ratios during inflammation, a process resulting in localized tissue hypoxia within inflammatory lesions ("inflammatory hypoxia"). As part of the adaptive immune response, T cells are recruited to sites of inflammatory hypoxia. Given the profound effects of hypoxia on gene regulation, we hypothesized that T-cell differentiation is controlled by hypoxia. To pursue this hypothesis, we analyzed the transcriptional consequences of ambient hypoxia (1% oxygen) on a broad panel of T-cell differentiation factors. Surprisingly, these studies revealed selective, robust induction of FoxP3, a key transcriptional regulator for regulatory T cells (Tregs). Studies of promoter binding or loss- and gain-of-function implicated hypoxia-inducible factor (HIF)-1α in inducing FoxP3. Similarly, hypoxia enhanced Treg abundance in vitro and in vivo. Finally, Treg-intrinsic HIF-1α was required for optimal Treg function and Hif1a-deficient Tregs failed to control T-cell-mediated colitis. These studies demonstrate that hypoxia is an intrinsic molecular cue that promotes FoxP3 expression, in turn eliciting potent anti-inflammatory mechanisms to limit tissue damage in conditions of reduced oxygen availability.


Conflict of interest statement

The authors declare no conflict of interest.

Figures

Fig. 1.
Fig. 1.
Hypoxia specifically activates FoxP3 transcription. (A) To study hypoxia as an environmental cue of the inflamed microenvironment, CD45RBhigh T-cell–mediated colitis was used as model inflammatory disease. CD3+ T cells (red) infiltrate into areas of hypoxia (green) during colitis (Left, lower magnification; Right, higher magnification of white dashed box). Shown is immunofluorescence on colonic tissue from Rag1-deficient mice that received 5 × 10⁵ CD45RBhigh CD4 T cells 10 wk prior, with tissue sections stained with hypoxyprobe (green) and nuclear counter staining with DAPI (blue). (Scale bar, 100 μm.) (B) qPCR analysis of mRNA expression in primary mouse CD4 T cells cultured in normoxia or hypoxia for 8 h. (C) Time course of FOXP3 (white bars) and PGK1 (black bars) mRNA in Jurkat T cells, measured by qPCR. (D) Flow cytometric analysis of FoxP3 protein in Jurkats exposed to hypoxia for 27 h (red) relative to normoxia (black) and an isotype control (gray). All plots show mean ± SEM, are representative of two to four independent experiments, and include statistical significance calculated by unpaired t test or ANOVA.
Fig. 2.
Fig. 2.
Hypoxia stimulates FoxP3 transcription through HIF-1α. (A) Magnetically enriched CD4 T cells from ODD-luciferase mice were cultured in either normoxia or hypoxia for 18 h, with some samples cultured with TCR stimulation (anti-CD3/CD28 beads), IL-2 ± TGF-β (0.75 ng/mL). Cells were then harvested and assessed for relative luciferase activity, with data presented as values standardized to total protein from four independent cultures. (B) mRNA expression in primary mouse naive CD4 T cells and Tregs relative to b-actin. (C) Flow cytometric analysis of HIF-1α protein in Jurkat cells in hypoxia for 6 h (red), in normoxia (black), or stained with an isotype control (gray). (D) Treatment of Jurkat cells with AKB-6899 (100 μM) for 1 h in normoxia induces FoxP3, measured by qPCR. (E) The human FOXP3 promoter is activated during hypoxia. Data show relative luciferase activity in Jurkat cells transfected either with empty pGL4.17 plasmid (left) or with a plasmid containing 900 bp of the proximal FOXP3 promoter (right), with cells cultured in normoxia (Nx) or hypoxia (Hyp) for 24 h posttransfection. Data show mean ± SEM from three independent experiments. (F) The human FOXP3 gene has many predicted HREs, shown as vertical lines (asterisks indicate sites without obvious conservation in the mouse). (G and H) HIF-1α protein binds directly to the FOXP3 promoter in Jurkat T cells cultured in hypoxia for 6 h, measured by ChIP followed by qPCR (G) or by gel electrophoresis (H), with primers designed to amplify the indicated HRE (location relative to TSS, see schematic). HIF-1α protein binding to the PGK1 promoter is a positive control. (I) Lentiviral knockdown of HIF-1α in Jurkat cells, showing HIF1A mRNA levels in control (white) or HIF-1α knockdown (black) Jurkats, measured by qPCR. (J) Percentage of change in FOXP3 mRNA in control (white) or HIF-1α knockdown (black) Jurkats relative to normoxia, measured by qPCR. Data in A depict mean ± SEM for four replicate cultures, from two independent experiments with statistical significance calculated by unpaired t test (comparing normoxia vs. hypoxia). All plots show mean ± SEM, are representative of two to three independent experiments, and include statistical significance calculated by unpaired t test.
Fig. 3.
Fig. 3.
Hypoxia enhances the relative abundance of Tregs after in vitro activation. (A) Hypoxia enhances the frequency of FoxP3+ CD4 T cells after in vitro stimulation of primary mouse CD4 T cells with soluble anti-CD3 antibody (1 μg/mL) in bulk splenocyte culture, comparing cells cultured in normoxia (Nx, white bar) or hypoxia (Hyp, black bar). (B) Hypoxia enhances the frequency of FoxP3+ CD4 T cells after in vitro stimulation of primary mouse CD4 T cells with soluble anti-CD3 antibody (1 μg/mL), IL-2, and TGF-β1 in bulk splenocyte culture, comparing cells cultured in normoxia (Nx, white bar) or hypoxia (Hyp, black bar). (C) Flow cytometric analysis of protein expression within FoxP3+ CD4 T cells after 3 d of stimulation in hypoxia (red line) or normoxia (gray shading). (D) Experimental scheme to test the effect of hypoxia on the induction of FoxP3 expression in different T-cell subsets (Tregs vs. non-Tregs). (E and F) Hypoxia enhances de novo FoxP3 expression in non-Tregs (E), while having no effect on the relative abundance of existing Tregs (F). CD4 T cells fom FoxP3-GFP mice were sorted either as CD25-negative Foxp3GFP-negative (non-Tregs) or Foxp3GFP-positive cells (Tregs) and then stimulated with anti-CD3/CD28 microbeads and IL-2 for 3–5 d in either normoxia or hypoxia. Viable CD4 T cells were then analyzed for expression FoxP3 GFP by flow cytometry, with data depicting mean ± SEM for three to six replicate cultures, from two independent experiments. (G and H) Absolute cell counts for either Tregs (G) or non-Tregs (H) following stimulation of naive CD4, FoxP3 cells isolated from FoxP3GFP mice with anti-CD3/CD28 microbeads and IL-2 for 3 d in either normoxia or hypoxia. CD4 T cells were defined as viable, MHC class II negative, CD4+ events by flow cytometry, which were either FoxP3+ (Tregs, in G) or FoxP3 (non-Tregs, in H), with data depicting mean ± SEM for nine replicate cultures, from two independent experiments. All plots show mean ± SEM representative of two to four independent experiments, with flow cytometric results from a minimum of triplicate cultures (A and B), and include statistical significance calculated by unpaired t test.
Fig. 4.
Fig. 4.
Hypoxia enhances the relative abundance of Tregs in vitro by a TGF-β–dependent mechanism. (A) Flow cytometric analysis of CD28, CTLA-4 (cell surface) within viable CD4 FoxP3+ T cells, or c-Rel within viable CD4 T cells following culture for 3–5 d in either normoxia (black line with gray shading) or hypoxia (red line). Analysis of c-Rel includes an isotype control stain (dark gray). Results are representative of three independent experiments. (B and C) Hypoxic induction of FoxP3 mRNA and protein in vitro is TGF-β dependent. Sorted naive, FoxP3 CD4 T cells from FoxP3-GFP mice were stimulated in normoxia (white bars) or hypoxia (black or gray bars) for 3 d, with or without a blocking TGF-β antibody (αTGF-β, 10 μg/mL). Relative abundance of FoxP3 expression was measured by GFP fluorescence (B, where GFP expression is under control of an internal ribosome entry site linked to the FoxP3 gene) or by antibody detection of FoxP3 protein by flow cytometry (C). Data depict the percentage of CD4+ events that are either GFP+ (B) or FoxP3+ (C), where all CD4 T cells were pregated on viable, MHC class II negative events. (D and E) Hypoxic enhancement of Tregs by TGF-β and the effect of inflammatory cytokines on this induction. Bulk splenocytes were cultured with soluble anti-CD3 antibody (1 μg/mL), IL-2 (10 ng/mL), and TGF-β1 (0.75 ng/mL), with or without a series of dilutions of either IL-6 (G) or IL-1 (H). The frequency of FoxP3+ events among CD4+ T cells was measured by flow cytometry after 3 d of stimulation in hypoxia (Hyp) or normoxia (Nx). All plots show mean ± SEM representative of two to three independent experiments, with flow cytometric results from triplicate cultures (B–E), and include statistical significance calculated by unpaired t test or ANOVA.
Fig. 5.
Fig. 5.
Hypoxia induces Tregs, not Th17 cells, under Treg differentiation conditions. (A and B) Hypoxia enhances the frequency of FoxP3+ CD4 T cells after in vitro stimulation of CD4 T cells in bulk splenocyte culture, with soluble anti-CD3 antibody (1 μg/mL), IL-2, and TGF-β1, comparing cells cultured in normoxia (Nx, white bar) or hypoxia (Hyp, black bar). Total splenocytes were cultured in normoxia (white bar) or hypoxia (black bar), using Treg differentiation conditions for 5 d, at which time cells were restimulated with PMA, ionomycin, and monensin for 5 h. Cells were then stained for FoxP3 and IL-17A expression, with data depicting the percentage of viable, activated CD4 T cells that express either FoxP3 (A) or IL-17A (B). (C) Flow cytometric analysis of RORγ expression within viable CD4 T cells, comparing relative expression in normoxic (black line) or hypoxic (red line) cultures relative to an isotype control stain (gray area). Results are representative of two independent experiments. (D and E) Hypoxia enhances differentiation of IL-17A+ cells after in vitro stimulation of CD4 T cells in bulk splenocyte culture, containing Th17-inducing conditions. Total splenocytes were cultured in normoxia (white bar) or hypoxia (black bar) under Th17 differentiation conditions for 5 d, at which time cells were restimulated with PMA, ionomycin, and monensin for 5 h. Cells were then stained for FoxP3 and IL-17A expression, with data depicting the percentage of viable, activated CD4 T cells that express either IL-17A (D) or FoxP3 (E). (F) Flow cytometric analysis of FoxP3 protein expression (Upper) or GFP expression (Lower) (a transcriptional reporter for FoxP3 expression) from FoxP3-GFP cells, following 5 d of stimulation in hypoxia (red line) or normoxia (gray area). (G) Ratio comparing the frequency of FoxP3 protein-expressing cells relative to the frequency of GFP-positive cells, using FoxP3-GFP transcriptional reporter mice, based on flow cytometric data as shown in F. Results are representative of two independent experiments. In A, B, and D, data depict mean ± SEM for four to six replicate cultures from two independent experiments and include statistical significance calculated by unpaired t test (comparing normoxia vs. hypoxia).
Fig. 6.
Fig. 6.
Hypoxia and HIF signaling enhance Treg abundance in vivo. (A) Whole-body hypoxia (10% O2) increases Treg abundance in the spleen after 24 h. Data show mean ± SEM, indicating percentage of live CD4 T cells that are FoxP3+, n = 4–5 mice per group, with data representative of two independent experiments and analyzed by unpaired t test. (B) Phenotype of Tregs after whole-body hypoxia, with histogram overlays comparing protein expression in Tregs in 21% (gray) or 10% O2 availability (black). (C) Treatment of mice with a PHD inhibitor increases FoxP3 mRNA expression in the thymus, measured by qPCR in thymus, in B6 mice treated with vehicle (control) or with AKB-4924. Data show mean ± SEM, n = 5 mice per group, representative of two independent experiments. Statistically significant differences are indicated, calculated by unpaired t test.
Fig. 7.
Fig. 7.
Treg-intrinsic HIF-1α is required for optimal Treg suppressive function in vitro and in vivo. (A and B) HIF-1α is required for optimal suppressive function of regulatory T cells in normoxia. Shown is in vitro Treg suppression assay using different ratios of CD4+ CD25+ T cells from Hif1a flox/flox (F/F) or Hif1a flox/flox LckCre+ mice cocultured with Violet Trace-labeled CD4+ CD25 T cells from Hif1a flox/flox mice, irradiated APCs, and soluble anti-CD3 (1 μg/mL). T-cell proliferation was assessed 4 d poststimulation, with data obtained from four independent cultures, with cells isolated from two independent mice. Data depict (A) the percentage of CD4+ CD25 T cells that have undergone at least one round of division, showing mean ± SEM for four independent cultures, and (B) proliferation of CD4+ CD25 T cells as measured by Violet Trace dilution at multiple different ratios of effector T cells to regulatory T cells, with control Treg cultures plotted in black (upper) and Hif1a–deficient Treg cultures plotted in red (lower). Statistically significant differences are indicated, calculated by unpaired t test. (C–I) Rag1−/− mice were adoptively transferred with CD4+ CD45RBhigh cells with or without CD4+ CD25+ Tregs from control mice or mice deficient in Hif1a in T cells (Hif1a F/F LckCre). Progression to colitis was monitored weekly by weight loss (C) or at the time of harvest by measuring colon length (D) or by histological scoring (E). Examples of histology in each of the groups are provided in F–I, corresponding to mice without T-cell transfer (F) or receiving CD45RBhigh cells without Tregs (G), CD45RBhigh cells + control Tregs (H), or CD45RBhigh cells + Hif1a–deficient Tregs (I). Data indicate mean ± SEM (n = 9–13 mice per group), from three independent experiments except for E, which shows data from n = 4–8 mice per group from two independent experiments. For Hif1a genotype, F refers to floxed. (Scale bars in FI, 200 μm.) Statistically significant differences are indicated, calculated by unpaired t test or by ANOVA with Tukey’s posttest correction.
Fig. P1.
Fig. P1.
Hypoxia via hypoxia-inducible factor (HIF)-1α induces Tregs, which limit inflammation. During T-cell–mediated intestinal inflammation (Top Left), CD3+ T cells (red) infiltrate into areas of hypoxia (green), with nuclear counterstaining (blue) (Top Right). (Middle) Hypoxia induces transcriptional changes via HIF-1α, including induction of the FoxP3 transcription factor within T cells, promoting the generation and function of anti-inflammatory regulatory T cells and subsequent restraint of intestinal inflammation. In the absence of Tregs, there is profound intestinal inflammation (Bottom Left). Whereas control Tregs (Bottom Center) limit intestinal inflammation, Hif1a deficiency in Tregs results in a failure to dampen intestinal inflammation (Bottom Right).

References

    1. Eltzschig HK, Carmeliet P. Hypoxia and inflammation. N Engl J Med. 2011;364:656–665. - PMC - PubMed
    1. Kominsky DJ, Campbell EL, Colgan SP. Metabolic shifts in immunity and inflammation. J Immunol. 2010;184:4062–4068. - PMC - PubMed
    1. Karhausen J, et al. Epithelial hypoxia-inducible factor-1 is protective in murine experimental colitis. J Clin Invest. 2004;114:1098–1106. - PMC - PubMed
    1. Ng CT, et al. Synovial tissue hypoxia and inflammation in vivo. Ann Rheum Dis. 2010;69:1389–1395. - PMC - PubMed
    1. Semenza GL. Oxygen homeostasis. Wiley Interdiscip Rev Syst Biol Med. 2010;2:336–361. - PubMed

Publication types

MeSH terms

Substances