. 2012 Nov 2;287(45):37891-906.
doi: 10.1074/jbc.M112.412635. Epub 2012 Sep 17.

Isozyme-specific interaction of protein kinase Cδ with mitochondria dissected using live cell fluorescence imaging

Affiliations

Isozyme-specific interaction of protein kinase Cδ with mitochondria dissected using live cell fluorescence imaging

Alyssa X Wu-Zhang et al. J Biol Chem. .

Abstract

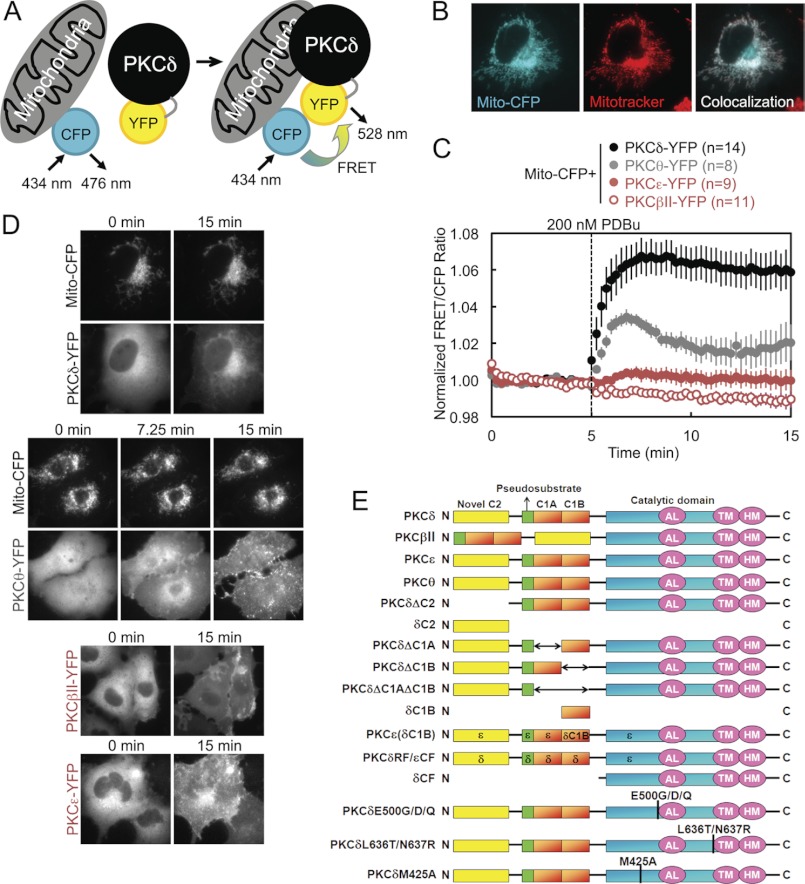
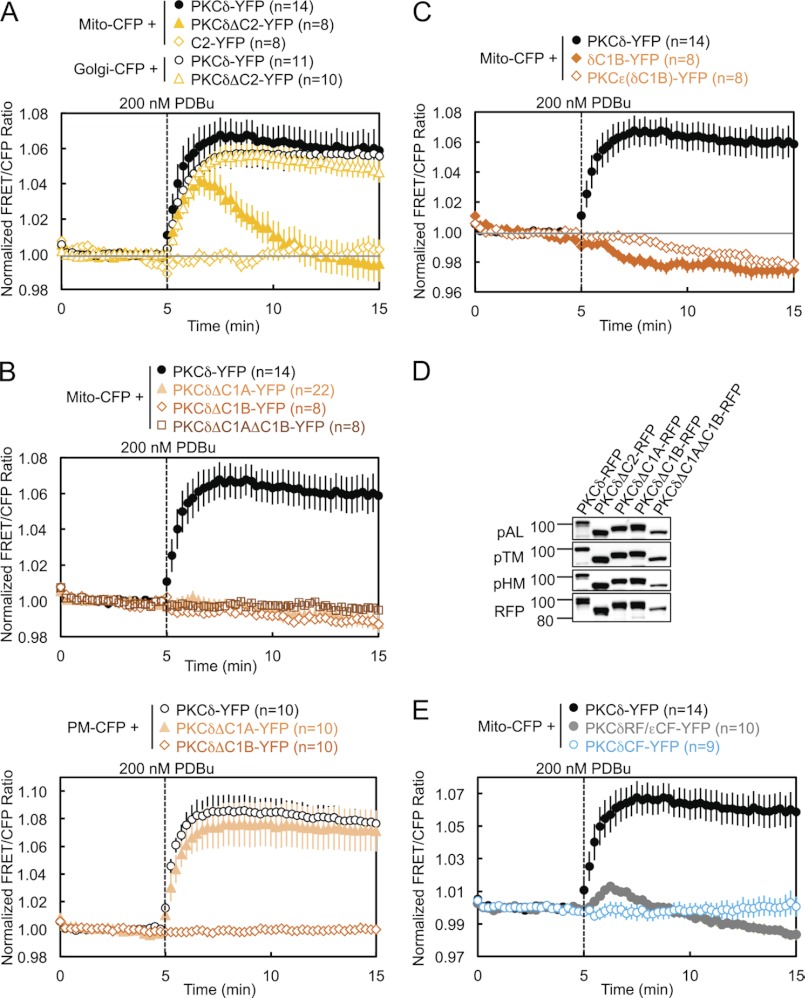
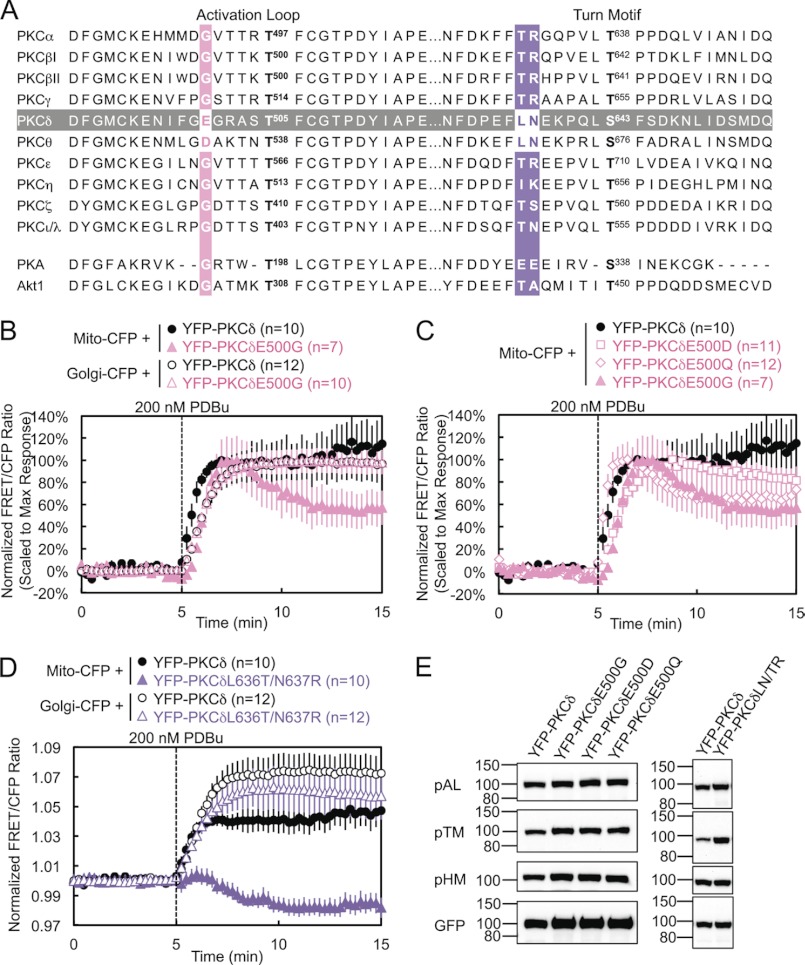
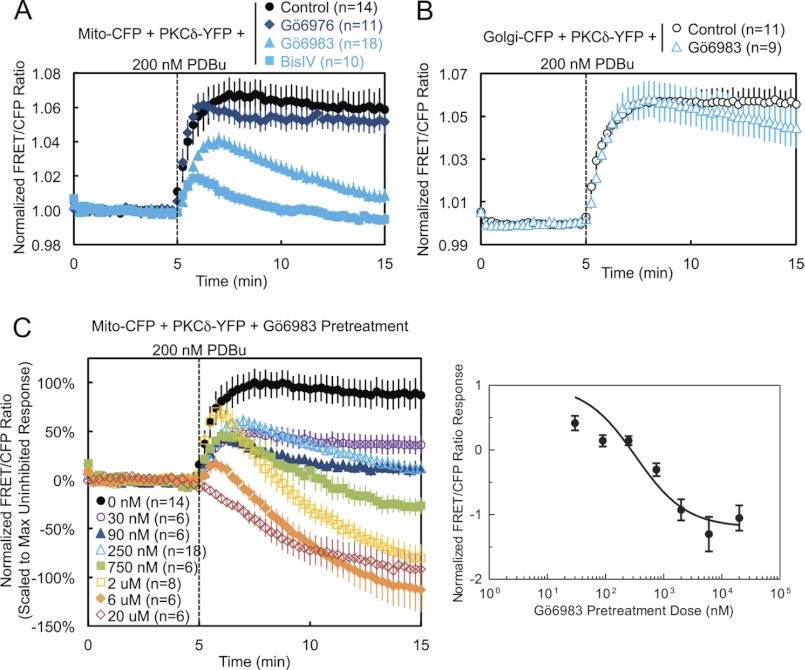
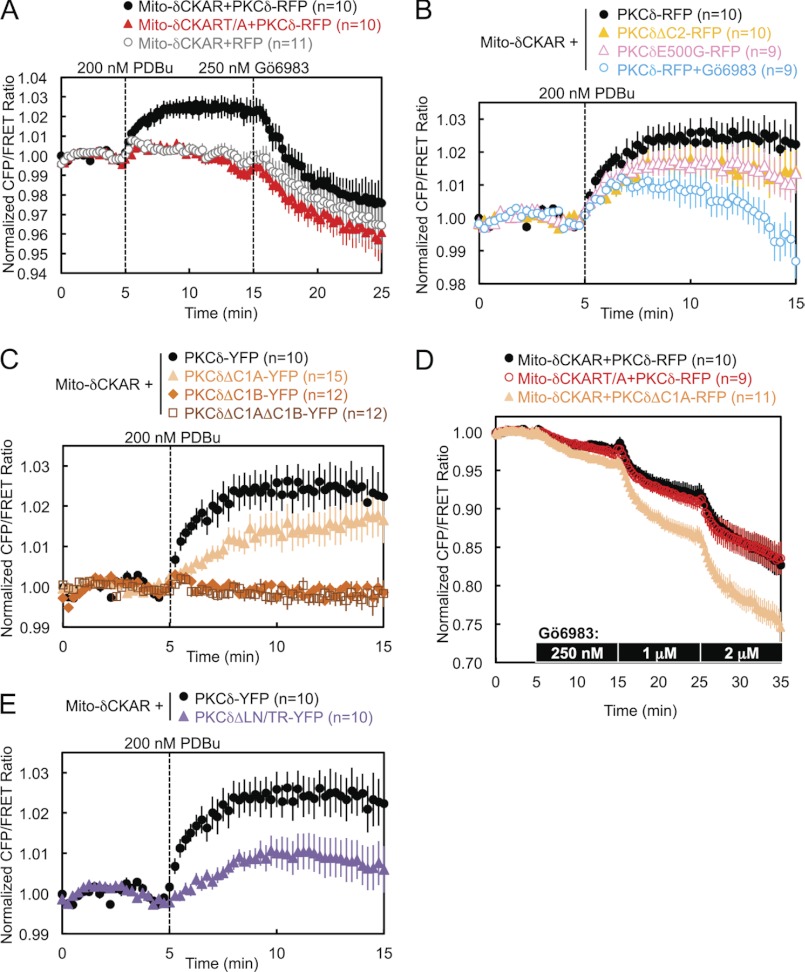
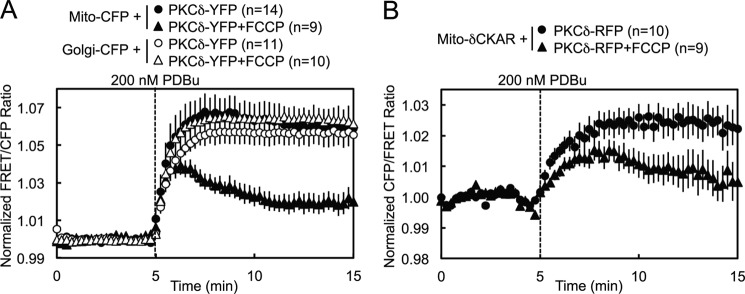
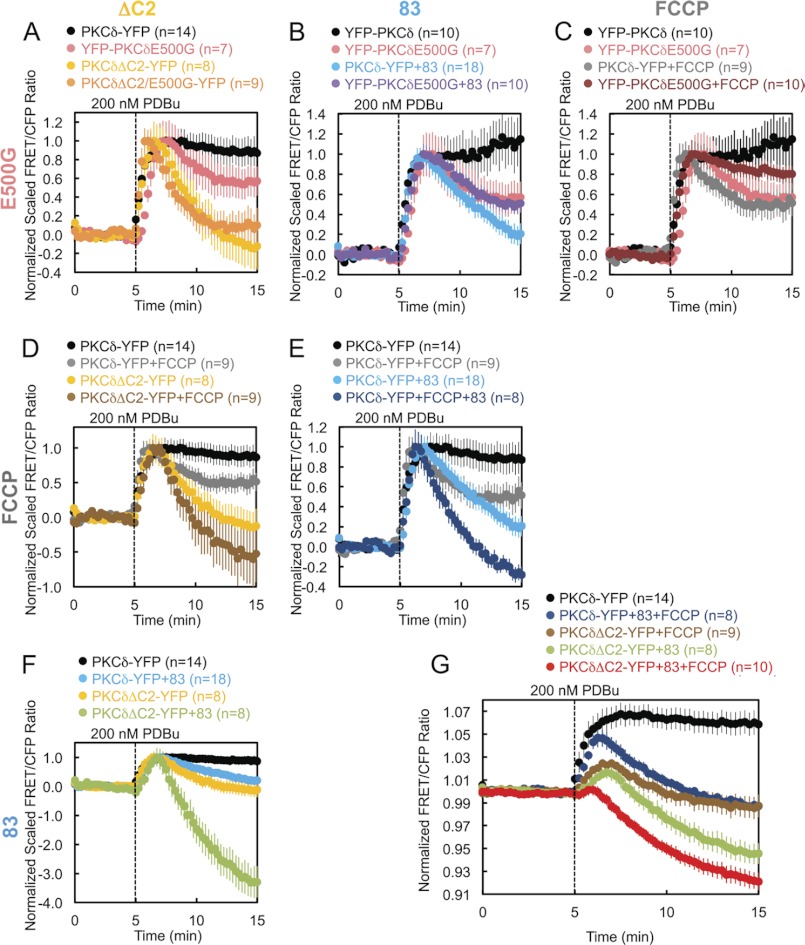
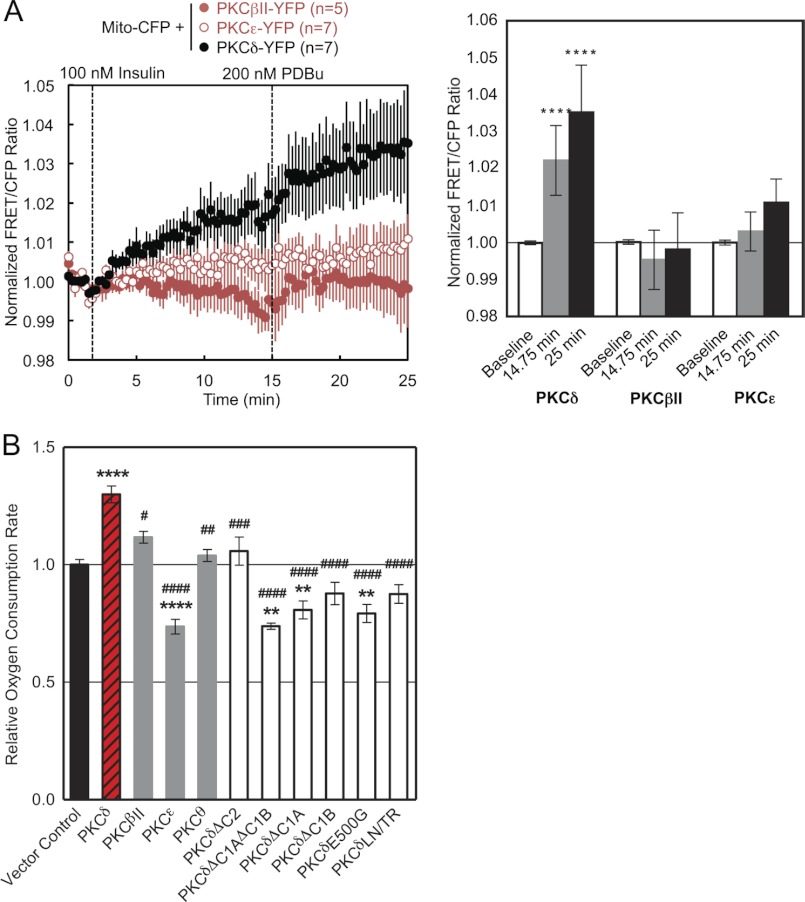
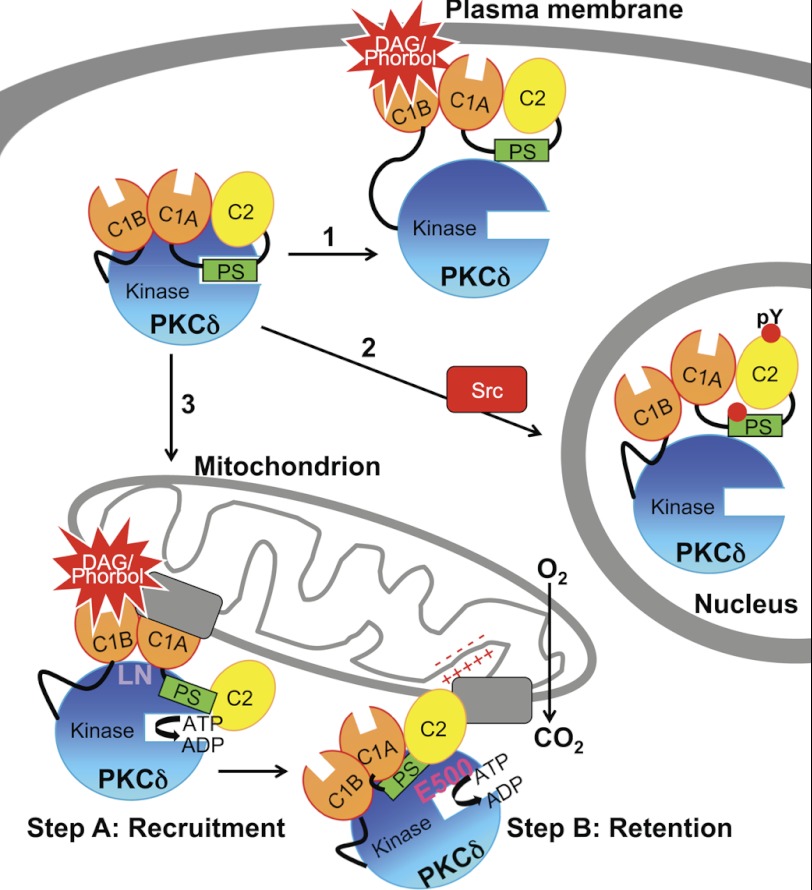
PKCδ signaling to mitochondria has been implicated in both mitochondrial apoptosis and metabolism. However, the mechanism by which PKCδ interacts with mitochondria is not well understood. Using FRET-based imaging, we show that PKCδ interacts with mitochondria by a novel and isozyme-specific mechanism distinct from its canonical recruitment to other membranes such as the plasma membrane or Golgi. Specifically, we show that PKCδ interacts with mitochondria following stimulation with phorbol esters or, in L6 myocytes, with insulin via a mechanism that requires two steps. In the first step, PKCδ translocates acutely to mitochondria by a mechanism that requires its C1A and C1B domains and a Leu-Asn sequence in its turn motif. In the second step, PKCδ is retained at mitochondria by a mechanism that depends on its C2 domain, a unique Glu residue in its activation loop, intrinsic catalytic activity, and the mitochondrial membrane potential. In contrast, of these determinants, only the C1B domain is required for the phorbol ester-stimulated translocation of PKCδ to other membranes. PKCδ also basally localizes to mitochondria and increases mitochondrial respiration via many of the same determinants that promote its agonist-evoked interaction. PKCδ localized to mitochondria has robust activity, as revealed by a FRET reporter of PKCδ-specific activity (δCKAR). These data support a model in which multiple determinants unique to PKCδ drive a specific interaction with mitochondria that promotes mitochondrial respiration.


Figures

FIGURE 1.
FIGURE 1.
Intermolecular FRET demonstrates that PKCδ interacts with mitochondria via an isozyme-specific mechanism. A, diagram of intermolecular FRET translocation reporter, in which an increase in the FRET signal between mitochondrially targeted CFP and YFP-tagged PKC constructs indicates PKC translocation to mitochondria. B, pseudocolored images of a COS-7 cell transfected with mitochondrially targeted CFP (Mito-CFP) and stained using MitoTracker for mitochondria. Co-localization of CFP and MitoTracker is indicated in white. C, COS-7 cells co-transfected with Mito-CFP and the indicated YFP-tagged PKC isozyme were stimulated with 200 nm PDBu during FRET imaging, which induced a rapid and sustained increase in the FRET/CFP ratio from PKCδ, a transient increase from PKCθ, and no significant change from either PKCβII or PKCϵ. Throughout this paper, FRET ratios are plotted as the means ± S.E. of data from the specified n number of cells imaged over at least three independent experiments. D, representative CFP and YFP channel time lapse images of COS-7 cells co-transfected with Mito-CFP and the indicated YFP-labeled PKC constructs and monitored for FRET ratio changes in response to PDBu stimulation. The specified times correspond to time points on the FRET ratio plots in C and indicate images captured at the beginning (0 min), the end (15 min), and, for PKCθ, the FRET ratio high point (7.25 min). The images for PKCδ and PKCθ visually show their translocation to mitochondria after PDBu stimulation. The images for PKCβII and PKCϵ show their PDBu-responsive translocation to other intracellular membranes, despite their lack of FRET responses at mitochondria. E, schematic of the PKC isozymes and PKCδ constructs used throughout the paper.
FIGURE 2.
FIGURE 2.
Regulatory domains of PKCδ are necessary but not sufficient for PDBu-induced translocation to and retention at mitochondria. A–C and E, COS-7 cells co-transfected with the indicated CFP and YFP constructs were monitored for their FRET ratio responses to stimulation with 200 nm PDBu. D, COS-7 cells transfected with the indicated PKCδ-RFP constructs were lysed and immunoblotted with phospho-specific antibodies against the activation loop (pAL), turn motif (pTM), and hydrophobic motif (pHM) of PKC and with the DsRed antibody for expression of the RFP-tagged constructs.
FIGURE 3.
FIGURE 3.
Critical residues in the activation loop and turn motif. A, amino acid sequence alignment of the activation loop and turn motif of all PKC isozymes, as well as of Akt and PKA. (PKCγ and δ, PKA, and Akt1 sequences are mouse; PKCϵ, θ, and ζ sequences are human; PKCα, βI, βII, η, and ι/λ sequences are the same between human and mouse and are shown with human numbering.) The sequence of PKCδ is highlighted in gray, and the alignments for the PKCδ residues mutated in the activation loop and turn motif are highlighted in pink and purple, respectively. B–D, COS-7 cells co-transfected with the indicated CFP and YFP constructs were monitored for their FRET ratio responses to stimulation with 200 nm PDBu. E, COS-7 cells transfected with the indicated YFP-PKCδ constructs were lysed and immunoblotted with phospho-specific antibodies against the activation loop (pAL), turn motif (pTM), and hydrophobic motif (pHM) of PKC and with the GFP antibody for expression of the YFP-tagged constructs.
FIGURE 4.
FIGURE 4.
Pharmacological inhibition demonstrates that PKCδ interaction with mitochondria is dependent on novel PKC activity. A, COS-7 cells co-transfected with Mito-CFP and PKCδ-YFP were pretreated with either 500 nm of the conventional PKC inhibitor Gö6976, 250 nm of the general PKC active site inhibitor Gö6983, or 2.5 μm of the general PKC substrate-uncompetitive inhibitor BisIV for at least 20 min at 37 °C and compared with unpretreated cells in their FRET ratio responses to 200 nm PDBu stimulation. B, COS-7 cells co-transfected with Golgi-CFP and PKCδ-YFP were pretreated with 250 nm Gö6983 for at least 20 min at 37 °C and compared with unpretreated cells in their FRET ratio responses to 200 nm PDBu stimulation. C, COS-7 cells co-transfected with Mito-CFP and PKCδ-YFP were pretreated with the indicated concentrations of Gö6983 for at least 20 min at 37 °C and compared with unpretreated cells in their FRET ratio responses to 200 nm PDBu stimulation (left panel). The means ± S.E. of the normalized FRET ratios at 15 min (after 10 min of PDBu stimulation) were plotted as a function of the log of the inhibitor concentration to generate a Gö6983 dose-response curve (right panel).
FIGURE 5.
FIGURE 5.
Specific inhibition of PKCδ activity prevents its retention at mitochondria. A, COS-7 cells transfected with CKAR alone or together with wild-type PKCδ-RFP or with the gatekeeper mutant PKCδM425A-RFP were stimulated with 200 nm PDBu and then inhibited with 1 μm NaPP1 during FRET imaging. B and C, COS-7 cells co-transfected with δCKAR and either RFP, PKCδ-RFP, or PKCδM425A-RFP were either stimulated with 200 nm PDBu and then inhibited with 1 μm NaPP1 (B) or first inhibited with 1 μm NaPP1 and then stimulated with 200 nm PDBu (C). D, COS-7 cells co-transfected with Mito-CFP and either PKCδ-YFP or PKCδM425A-RFP were either left unpretreated/pretreated with Me2SO vehicle control or pretreated with 1 μm NaPP1 for 30 min at 37 °C before 200 nm PDBu stimulation during FRET imaging. E, COS-7 cells co-transfected with CFP-targeted to the plasma membrane (PM-CFP) and either PKCδ-YFP or PKCδM425A-RFP were either left unpretreated/pretreated with Me2SO vehicle control or pretreated with 1 μm NaPP1 for 30 min at 37 °C before 200 nm PDBu stimulation during FRET imaging. F, COS-7 cells co-transfected with δCKAR and PKCδ-RFP were pretreated with either Me2SO vehicle control, 10 μm rottlerin, or 750 nm Gö6983 for 30 min at 37 °C before PDBu stimulation during FRET imaging.
FIGURE 6.
FIGURE 6.
Mitochondrially targeted δCKAR reveals that PKCδ is active at mitochondria. A, COS-7 cells co-transfected with either Mito-δCKAR or the negative control reporter Mito-δCKART/A and either PKCδ-RFP or RFP were monitored for their FRET ratio responses to stimulation with 200 nm PDBu and inhibition with 250 nm Gö6983. B, C, and E, COS-7 cells co-transfected with Mito-δCKAR and the indicated RFP-tagged PKCδ constructs were monitored for their FRET ratio responses to stimulation with 200 nm PDBu. D, COS-7 cells co-transfected with either Mito-δCKAR or Mito-δCKART/A and either PKCδ-RFP or PKCδΔC1A-RFP were titrated with the indicated increasing net concentrations of Gö6983.
FIGURE 7.
FIGURE 7.
Mitochondrial membrane potential modulates the retention of PKCδ at mitochondria. A, COS-7 cells co-transfected with either Mito-CFP or Golgi-CFP and PKCδ-YFP were pretreated with 500 nm of the mitochondrial uncoupler FCCP for 15 min at room temperature and compared with unpretreated controls in their FRET ratio responses to 200 nm PDBu stimulation. B, COS-7 cells co-transfected with Mito-δCKAR and PKCδ-RFP were pretreated with 500 nm FCCP for 30 min at 37 °C and compared with the unpretreated control in their FRET ratio responses to 200 nm PDBu stimulation.
FIGURE 8.
FIGURE 8.
Independent versus coincident mechanisms of PKCδ interaction with mitochondria. A–G, COS-7 cells co-transfected with Mito-CFP and the indicated YFP-tagged PKCδ constructs were monitored for their FRET ratio responses to stimulation with 200 nm PDBu. Some dishes were pretreated with 250 nm Gö6983 (83) and/or 500 nm FCCP, as indicated, for 30 min at 37 °C. A–F, each graph presents the separate and combined effects of two of the four perturbations that affect the retention of PKCδ at mitochondria, with the pairings of perturbations indicated by the column and row headers. The data were scaled to the maximal PDBu-stimulated response for each experiment after normalization to average base-line values. G, the three perturbations found to independently disrupt PKCδ interactions with mitochondria were combined, and the result was juxtaposed to those of unperturbed PKCδ and each of the three possible pairings of the independent perturbations.
FIGURE 9.
FIGURE 9.
Functional effects of PKCδ interaction with mitochondria. A, L6 myocytes co-transfected with Mito-CFP and YFP-tagged PKCδ, PKCβII, or PKCϵ were monitored for their FRET ratio responses to stimulation with 100 nm insulin followed by 200 nm PDBu (left panel). The bar graph shows the mean FRET ratios before the addition of agonists (Baseline), after 13 min of insulin stimulation (14.75 min), and after an additional 10 min of PDBu stimulation (25 min) (right panel). The level of statistically significant differences is indicated as follows: ****, p < 0.0001 compared with PKCδ base line by Šídák's multiple comparison post hoc test following one-way analysis of variance. B, the maximal oxygen consumption rates of COS-7 cells transfected with the indicated constructs were measured after treatment with 2 μm oligomycin and 750 nm FCCP using a Seahorse Extracellular Flux Analyzer XF96. For each experiment, the data were gathered in quintuplicate and normalized to the vector control group. The data plotted reflect the cumulative means ± S.E. of six (vector control), five (PKCδ), three (PKCδΔC1B), two (PKCβII, PKCϵ, PKCδΔC2, PKCδΔC1A, PKCδE500G, PKCδLN/TR), or one (PKCθ, PKCδΔC1AΔC1B) independent experiments. The levels of statistically significant differences are indicated as follows: **, p < 0.01 and ****, p < 0.0001 compared with vector control and #, p < 0.05; ##, p < 0.01; ###, p < 0.001; ####, p < 0.0001 compared with PKCδ by both Bonferroni's and Šídák's multiple comparison post hoc tests following one-way analysis of variance.
FIGURE 10.
FIGURE 10.
Model showing three mechanisms for the agonist-evoked redistribution of cytosolic PKCδ to intracellular compartments and summarizing the determinants involved in its interaction with mitochondria. Arrow 1, canonical binding of PKCδ to DAG-containing membranes such as the plasma membrane (shown) and Golgi is mediated by the C1B domain. Arrow 2, Src-dependent translocation of PKCδ to the nucleus depends on Tyr phosphorylation (indicated by red circles) of PKCδ. Arrow 3, the novel, isozyme-specific interaction of PKCδ with mitochondria occurs via two steps: step A, an initial recruitment step that depends on the C1A and C1B domains and on Leu-Asn (LN) in the turn motif, and step B, a retention step that depends on four elements: the C2 domain, an acidic residue in the activation loop (Glu-500, E500), intrinsic catalytic activity (represented by ATPADP), and the mitochondrial membrane potential (represented by plus and minus signs). One or more protein scaffolds (gray rectangles) at mitochondria are hypothesized to mediate this interaction, which promotes mitochondrial respiration.

References

    1. Newton A. C. (2010) Protein kinase C. Poised to signal. Am. J. Physiol. Endocrinol Metab. 298, E395–E402 - PMC - PubMed
    1. Griner E. M., Kazanietz M. G. (2007) Protein kinase C and other diacylglycerol effectors in cancer. Nat. Rev. Cancer 7, 281–294 - PubMed
    1. Steinberg S. F. (2008) Structural basis of protein kinase C isoform function. Physiol. Rev. 88, 1341–1378 - PMC - PubMed
    1. Reyland M. E. (2009) Protein kinase C isoforms. Multi-functional regulators of cell life and death. Front. Biosci. 14, 2386–2399 - PMC - PubMed
    1. Rosse C., Linch M., Kermorgant S., Cameron A. J., Boeckeler K., Parker P. J. (2010) PKC and the control of localized signal dynamics. Nat. Rev. Mol. Cell Biol. 11, 103–112 - PubMed

Publication types

MeSH terms

LinkOut - more resources