. 2013 Apr;33(2):162-74.
doi: 10.1111/j.1440-1789.2012.01344.x. Epub 2012 Sep 19.

Bimodal anti-glioma mechanisms of cilengitide demonstrated by novel invasive glioma models

Affiliations

Bimodal anti-glioma mechanisms of cilengitide demonstrated by novel invasive glioma models

Manabu Onishi et al. Neuropathology. 2013 Apr.

Abstract

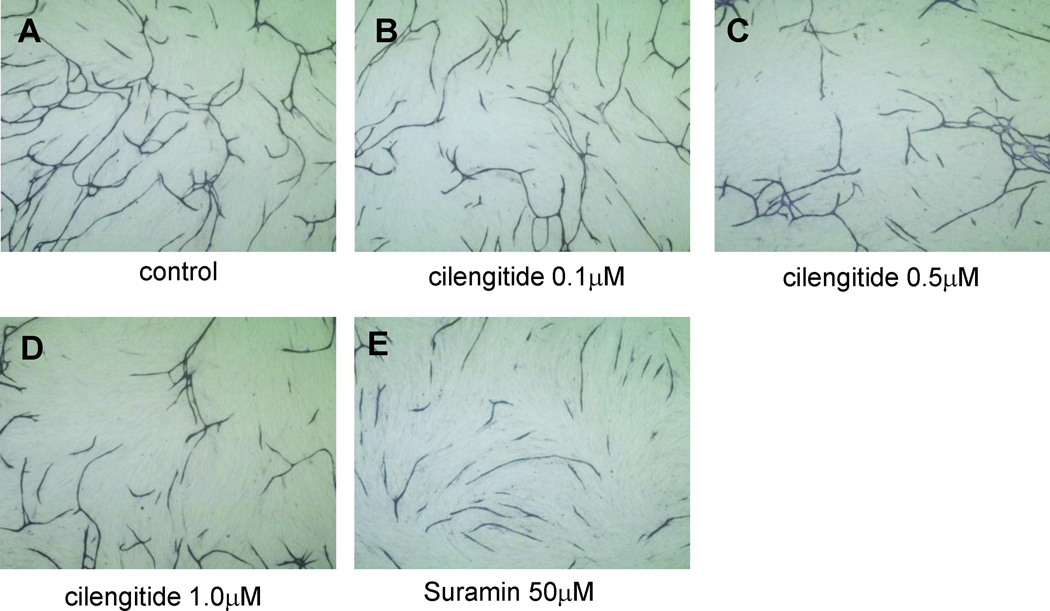
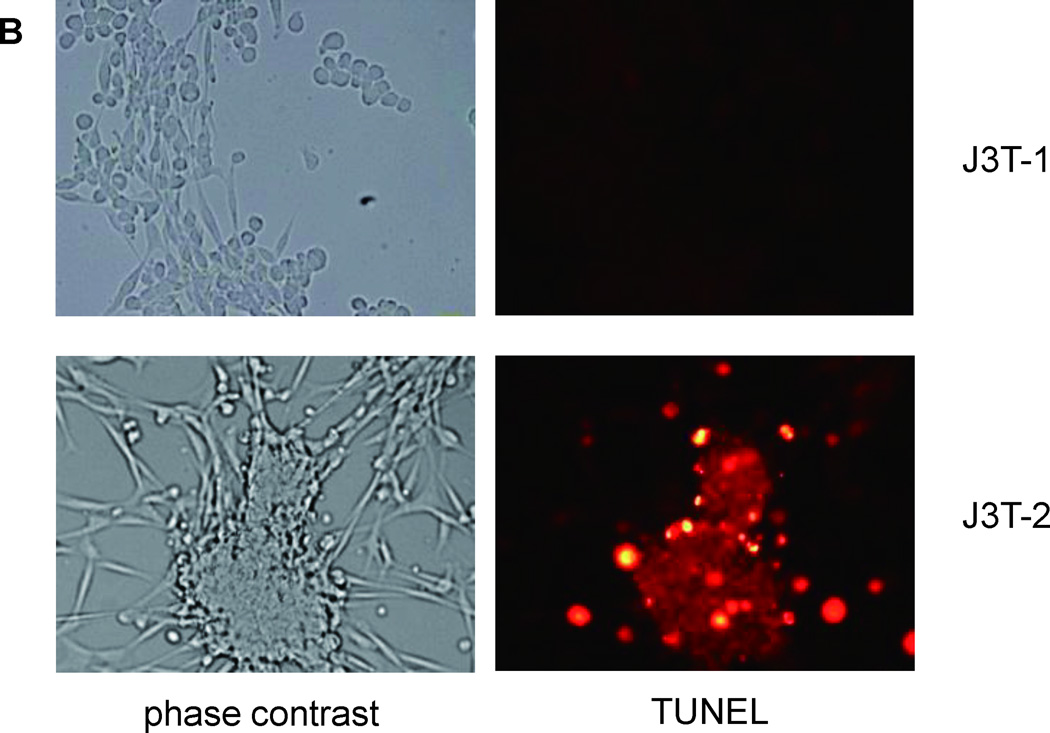
Integrins are expressed in tumor cells and tumor endothelial cells, and likely play important roles in glioma angiogenesis and invasion. We investigated the anti-glioma mechanisms of cilengitide (EMD121974), an αvβ3 integrin inhibitor, utilizing the novel invasive glioma models, J3T-1 and J3T-2. Immunohistochemical staining of cells in culture and brain tumors in rats revealed positive αvβ3 integrin expression in J3T-2 cells and tumor endothelial cells, but not in J3T-1 cells. Established J3T-1 and J3T-2 orthotopic gliomas in athymic rats were treated with cilengitide or solvent. J3T-1 gliomas showed perivascular tumor cluster formation and angiogenesis, while J3T-2 gliomas showed diffuse single-cell infiltration without obvious angiogenesis. Cilengitide treatment resulted in a significantly decreased diameter of the J3T-1 tumor vessel clusters and its core vessels when compared with controls, while an anti-invasive effect was shown in the J3T-2 glioma with a significant reduction of diffuse cell infiltration around the tumor center. The survival of cilengitide-treated mice harboring J3T-1 tumors was significantly longer than that of control animals (median survival: 57.5 days and 31.8 days, respectively, P < 0.005), while cilengitide had no effect on the survival of mice with J3T-2 tumors (median survival: 48.9 days and 48.5, P = 0.69). Our results indicate that cilengitide exerts a phenotypic anti-tumor effect by inhibiting angiogenesis and glioma cell invasion. These two mechanisms are clearly shown by the experimental treatment of two different animal invasive glioma models.


Figures

Fig. 1
Fig. 1
In vitro and in vivo immunohistochemical analysis of αvβ3 integrin expression in J3T-1 and J3T-2 cells. Immunofluorescence of αvβ3 integrin in cultured cells was negative in J3T-1 cells (A) and positive on the surface of J3T-2 cells (B). Scale bar = 50 µm. Immunohistochemical staining for αvβ3 integrin in brain slices revealed that the J3T-1 glioma cells were negative for αvβ3 integrin, yet the endothelial cells of dilated tumor vessels were positive (C). J3T-2 glioma cells were diffusely positive for αvβ3 integrin (D). Scale bar = 50 µm.
Fig. 2
Fig. 2
Effects of cilengitide on tube formation. HUVECs co-cultured with fibroblasts and VEGF (10 ng/mL) without cilengitide (A) or with cilengitide (0.1, 0.5, 1.0 µM) (B–D) or suramin (50 µM) (E) for ten days. The length of tube-like structures was measured quantitatively using an image analyzer. The tube length was significantly shortened with cilengitide treatment in a concentration-dependent manner (*P = 0.0062, **P = 0.0089). (mean ± SE, n = 6)
Fig. 2
Fig. 2
Effects of cilengitide on tube formation. HUVECs co-cultured with fibroblasts and VEGF (10 ng/mL) without cilengitide (A) or with cilengitide (0.1, 0.5, 1.0 µM) (B–D) or suramin (50 µM) (E) for ten days. The length of tube-like structures was measured quantitatively using an image analyzer. The tube length was significantly shortened with cilengitide treatment in a concentration-dependent manner (*P = 0.0062, **P = 0.0089). (mean ± SE, n = 6)
Fig. 3
Fig. 3
Direct cytotoxic effects of cilengitide on the J3T-1 and J3T-2 glioma cells in culture. Morphological changes were observed after cilengitide treatment (0.1, 0.5, or 1.0 µM) in a dose-dependent manner. Some of the J3T-1 cells became spherical but did not detach from the plate (upper panel in A). J3T-2 cells become spherical and agglutinated. Some of the deformed cells detached from the plate (lower panel in A). Deformed cells were stained red by TUNEL treatment in J3T-2 cells (lower panel in B), but not in J3T-1 cells (upper panel in B). A significant inhibitory effect on the proliferation of J3T-2 cells was observed (*P < 0.005), but was not seen in J3T-1 cells (P = 0.992) (C). (mean ± SE, n = 6)
Fig. 3
Fig. 3
Direct cytotoxic effects of cilengitide on the J3T-1 and J3T-2 glioma cells in culture. Morphological changes were observed after cilengitide treatment (0.1, 0.5, or 1.0 µM) in a dose-dependent manner. Some of the J3T-1 cells became spherical but did not detach from the plate (upper panel in A). J3T-2 cells become spherical and agglutinated. Some of the deformed cells detached from the plate (lower panel in A). Deformed cells were stained red by TUNEL treatment in J3T-2 cells (lower panel in B), but not in J3T-1 cells (upper panel in B). A significant inhibitory effect on the proliferation of J3T-2 cells was observed (*P < 0.005), but was not seen in J3T-1 cells (P = 0.992) (C). (mean ± SE, n = 6)
Fig. 4
Fig. 4
Anti-angiogenic effects of cilengitide on the J3T-1 gliomas in rats. Low magnification of HE staining of control tumors (A) and cilengitide-treated tumors (B) revealed the same invasive pattern of cluster formation around dilated neovasculature. However, the spread of the invasion clusters was significantly smaller in animals treated with cilengitide compared with control animals. Scale bar = 2.0mm. When examined with immunofluorescence staining (vascular: RECA-1, red; nuclei: DAPI, blue), the diameter of the tumor clusters and its core vessels in cilengitide-treated animals (D) was smaller than that in untreated animals (C). Scale bar = 100 µm. The quantitative analysis of the diameter of the tumor clusters (E) and its core vessels (F) revealed a significant decrease in cilengitide-treated animals compared with control animals (P<0.005). (mean ± SE, n = 3)
Fig. 4
Fig. 4
Anti-angiogenic effects of cilengitide on the J3T-1 gliomas in rats. Low magnification of HE staining of control tumors (A) and cilengitide-treated tumors (B) revealed the same invasive pattern of cluster formation around dilated neovasculature. However, the spread of the invasion clusters was significantly smaller in animals treated with cilengitide compared with control animals. Scale bar = 2.0mm. When examined with immunofluorescence staining (vascular: RECA-1, red; nuclei: DAPI, blue), the diameter of the tumor clusters and its core vessels in cilengitide-treated animals (D) was smaller than that in untreated animals (C). Scale bar = 100 µm. The quantitative analysis of the diameter of the tumor clusters (E) and its core vessels (F) revealed a significant decrease in cilengitide-treated animals compared with control animals (P<0.005). (mean ± SE, n = 3)
Fig. 5
Fig. 5
Anti-invasive effects of cilengitide on the J3T-2 gliomas in rats. HE staining of control tumors (A) and cilengitide-treated tumors (B) revealed that tumor cells gradually dispersed from the tumor center to the normal brain parenchyma with a cell density gradient in both tumors. Scale bar = 2 mm. Immunofluorescence staining (vascular endothelial cells: RECA-1, red; nuclei: DAPI, blue) of control tumors (C) and cilengitide-treated tumors (D) revealed that the tumor borders of the treated tumors were more evident. Scale bar = 500 µm. The cell density was higher at the center of the tumor and lower at the periphery of the infiltration area in animals treated with cilengitide compared with control animals (E). There were no significant differences in the cell numbers in the examined areas (F) (P = 0.27). (mean ± SE, n = 3)
Fig. 5
Fig. 5
Anti-invasive effects of cilengitide on the J3T-2 gliomas in rats. HE staining of control tumors (A) and cilengitide-treated tumors (B) revealed that tumor cells gradually dispersed from the tumor center to the normal brain parenchyma with a cell density gradient in both tumors. Scale bar = 2 mm. Immunofluorescence staining (vascular endothelial cells: RECA-1, red; nuclei: DAPI, blue) of control tumors (C) and cilengitide-treated tumors (D) revealed that the tumor borders of the treated tumors were more evident. Scale bar = 500 µm. The cell density was higher at the center of the tumor and lower at the periphery of the infiltration area in animals treated with cilengitide compared with control animals (E). There were no significant differences in the cell numbers in the examined areas (F) (P = 0.27). (mean ± SE, n = 3)
Fig. 6
Fig. 6
Cytotoxic effects of cilengitide on the J3T-1 and J3T-2 rat brain tumors. A subpopulation of apoptotic cells were visualized by TUNEL staining (apoptotic cells: TMR red; nuclei: DAPI, blue) of J3T-1 control tumors (A), J3T-1 cilengitide-treated tumors (B), J3T-2 control tumors (C), and J3T-2 cilengitide-treated tumors (D). Scale bar = 100 µm. The quantitative analysis of the number of the apoptotic cells/HPF in J3T-1 tumors (E) and J3T-2 tumors (F) revealed no significant difference between control and cilengitide-treated animals (J3T-1, P=0.5972; J3T-2, P=0.4233). (mean ± SE, n = 6)
Fig. 7
Fig. 7
Survival of athymic mice harboring J3T-1 or J3T-2 brain tumors treated with cilengitide. Kaplan–Meier survival analysis of athymic mice harboring intracranial J3T-1 (A) and J3T-2 (B) brain tumors treated with cilengitide or PBS. The survival time of J3T-1 glioma mice was significantly prolonged by the intraperitoneal injection of cilengitide (A) (P < 0.005) while the survival of J3T-2 glioma mice was not prolonged (B) (P = 0.6889).

Similar articles

Cited by

References

    1. Stupp R, Mason WP, van den Bent MJ, et al. Radiotherapy plus concomitant and adjuvant temozolomide for glioblastoma. N Engl J Med. 2005 Mar 10;352(10):987–996. - PubMed
    1. Chatterjee S, Matsumura A, Schradermeier J, Gillespie GY. Human malignant glioma therapy using anti-alpha(v)beta3 integrin agents. J Neurooncol. 2000;46(2):135–144. - PubMed
    1. Tate MC, Aghi MK. Biology of angiogenesis and invasion in glioma. Neurotherapeutics. 2009 Jul;6(3):447–457. - PMC - PubMed
    1. Onishi M, Ichikawa T, Kurozumi K, Date I. Angiogenesis and invasion in glioma. Brain Tumor Pathol. 2011 Feb;28(1):13–24. - PubMed
    1. Kerbel R, Folkman J. Clinical translation of angiogenesis inhibitors. Nat Rev Cancer. 2002 Oct;2(10):727–739. - PubMed

Publication types