

Chromatin signature discovery via histone modification profile alignments
- PMID: 22989711
- PMCID: PMC3505981
- DOI: 10.1093/nar/gks848
Chromatin signature discovery via histone modification profile alignments
Abstract
We report on the development of an unsupervised algorithm for the genome-wide discovery and analysis of chromatin signatures. Our Chromatin-profile Alignment followed by Tree-clustering algorithm (ChAT) employs dynamic programming of combinatorial histone modification profiles to identify locally similar chromatin sub-regions and provides complementary utility with respect to existing methods. We applied ChAT to genomic maps of 39 histone modifications in human CD4(+) T cells to identify both known and novel chromatin signatures. ChAT was able to detect chromatin signatures previously associated with transcription start sites and enhancers as well as novel signatures associated with a variety of regulatory elements. Promoter-associated signatures discovered with ChAT indicate that complex chromatin signatures, made up of numerous co-located histone modifications, facilitate cell-type specific gene expression. The discovery of novel L1 retrotransposon-associated bivalent chromatin signatures suggests that these elements influence the mono-allelic expression of human genes by shaping the chromatin environment of imprinted genomic regions. Analysis of long gene-associated chromatin signatures point to a role for the H4K20me1 and H3K79me3 histone modifications in transcriptional pause release. The novel chromatin signatures and functional associations uncovered by ChAT underscore the ability of the algorithm to yield novel insight on chromatin-based regulatory mechanisms.
Figures
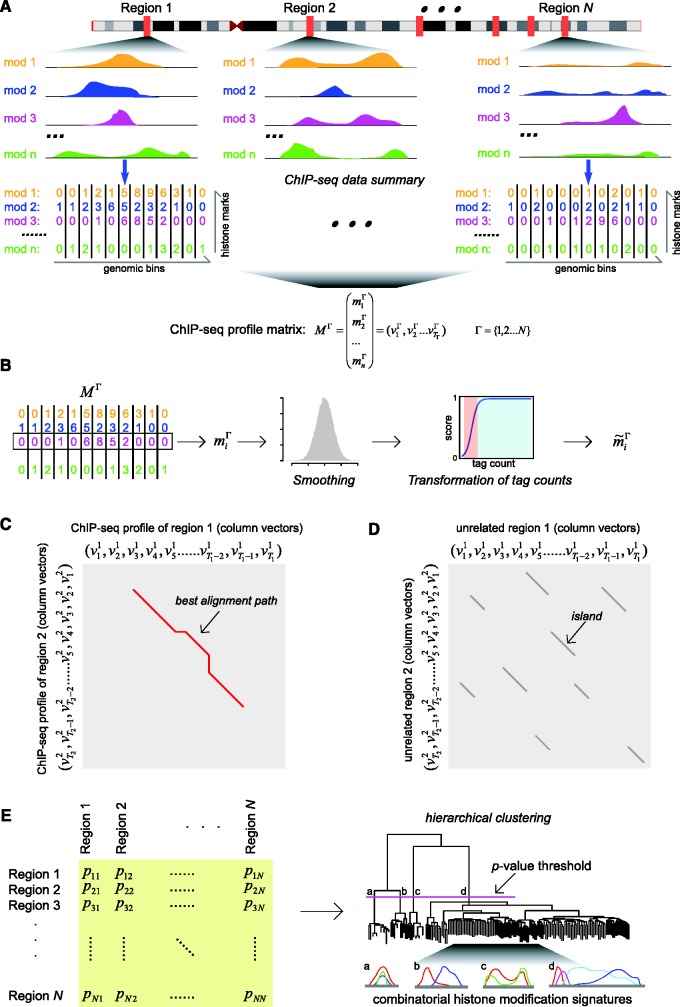
 genomic regions, combinatorial histone modification distributions are represented by ChIP-seq profile matrices. Each genomic region under consideration is divided into 200 bp non-overlapping bins and each bin is associated with a column vector (
 ) summarizing the ChIP-seq tag counts for
  different histone modifications. The contiguous landscape of each individual histone modification along the genomic region is represented by the corresponding row vector (
 ). (B) Histone modification ChIP-seq tag counts are smoothed and transformed to produce normalized scores. (C) Dynamic programming is used to identify sub-regions with similar chromatin signatures. For each pair of genomic regions, a local dynamic programming algorithm is used to compare column vectors
  vs.
vs.  (i.e. the combinatorial histone modification signatures of individual genomic bins), and the best alignment path (red) is identified. (D) Pairwise P-values are computed based on a null distribution of high-scoring chromatin segment pairs (islands) found between unrelated genomic regions. Dynamic programming is used to identify high-scoring islands (grey lines), and the score distributions of the islands are used to estimate the parameters of extreme-value distributions for P-value calculation. (E) Pairwise P-values are organized into a distance matrix that is used for hierarchical clustering of similar chromatin sub-regions. The resulting tree of chromatin signatures can be partitioned using an explicit P-value threshold (purple line) to identify groups of related signatures.
Similar articles
-
ChromaSig: a probabilistic approach to finding common chromatin signatures in the human genome.PLoS Comput Biol. 2008 Oct;4(10):e1000201. doi: 10.1371/journal.pcbi.1000201. Epub 2008 Oct 17. PLoS Comput Biol. 2008. PMID: 18927605 Free PMC article.
-
Combinatorial chromatin modification patterns in the human genome revealed by subspace clustering.Nucleic Acids Res. 2011 May;39(10):4063-75. doi: 10.1093/nar/gkr016. Epub 2011 Jan 25. Nucleic Acids Res. 2011. PMID: 21266477 Free PMC article.
-
DELTA: A Distal Enhancer Locating Tool Based on AdaBoost Algorithm and Shape Features of Chromatin Modifications.PLoS One. 2015 Jun 19;10(6):e0130622. doi: 10.1371/journal.pone.0130622. eCollection 2015. PLoS One. 2015. PMID: 26091399 Free PMC article.
-
Enhancer identification in mouse embryonic stem cells using integrative modeling of chromatin and genomic features.BMC Genomics. 2012 Apr 26;13:152. doi: 10.1186/1471-2164-13-152. BMC Genomics. 2012. PMID: 22537144 Free PMC article.
-
Chromatin signatures of active enhancers.Nucleus. 2012 Mar 1;3(2):126-31. doi: 10.4161/nucl.19232. Epub 2012 Mar 1. Nucleus. 2012. PMID: 22555596 Free PMC article. Review.
Cited by
-
Spectacle: fast chromatin state annotation using spectral learning.Genome Biol. 2015 Feb 12;16(1):33. doi: 10.1186/s13059-015-0598-0. Genome Biol. 2015. PMID: 25786205 Free PMC article.
-
ChARM: Discovery of combinatorial chromatin modification patterns in hepatitis B virus X-transformed mouse liver cancer using association rule mining.BMC Bioinformatics. 2016 Dec 13;17(Suppl 16):452. doi: 10.1186/s12859-016-1307-z. BMC Bioinformatics. 2016. PMID: 28105934 Free PMC article.
-
L1 retrotransposons, cancer stem cells and oncogenesis.FEBS J. 2014 Jan;281(1):63-73. doi: 10.1111/febs.12601. Epub 2013 Nov 28. FEBS J. 2014. PMID: 24286172 Free PMC article. Review.
-
Genome-wide search for Zelda-like chromatin signatures identifies GAF as a pioneer factor in early fly development.Epigenetics Chromatin. 2017 Jul 4;10(1):33. doi: 10.1186/s13072-017-0141-5. Epigenetics Chromatin. 2017. PMID: 28676122 Free PMC article.
-
CHANGE POINT ANALYSIS OF HISTONE MODIFICATIONS REVEALS EPIGENETIC BLOCKS LINKING TO PHYSICAL DOMAINS.Ann Appl Stat. 2016 Mar;10(1):506-526. doi: 10.1214/16-AOAS905. Epub 2016 Mar 25. Ann Appl Stat. 2016. PMID: 27231496 Free PMC article.
References
Publication types
MeSH terms
Substances
LinkOut - more resources
Full Text Sources
Research Materials
