. 2012 Dec 13:226:101-18.
doi: 10.1016/j.neuroscience.2012.09.012. Epub 2012 Sep 16.

In vivo voltage-dependent influences on summation of synaptic potentials in neurons of the lateral nucleus of the amygdala

Affiliations

In vivo voltage-dependent influences on summation of synaptic potentials in neurons of the lateral nucleus of the amygdala

J A Rosenkranz. Neuroscience. .

Abstract

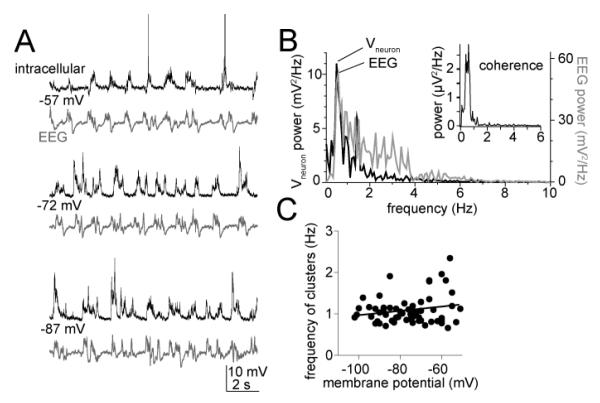
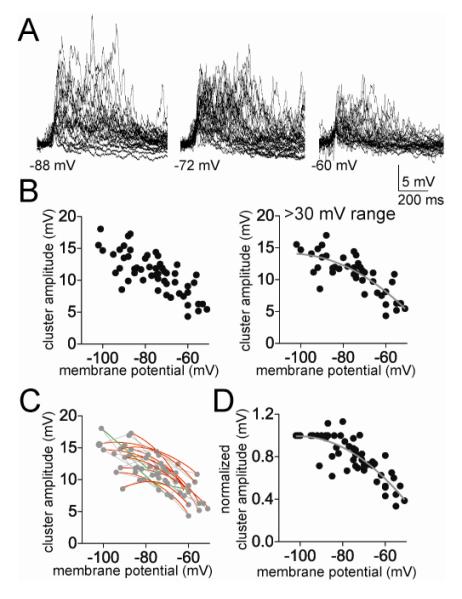
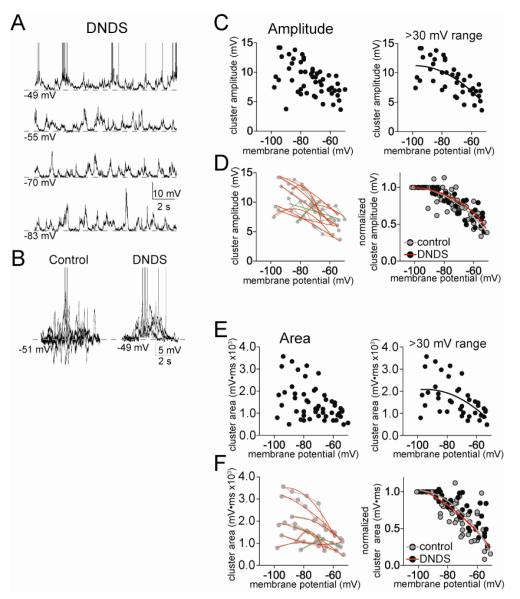
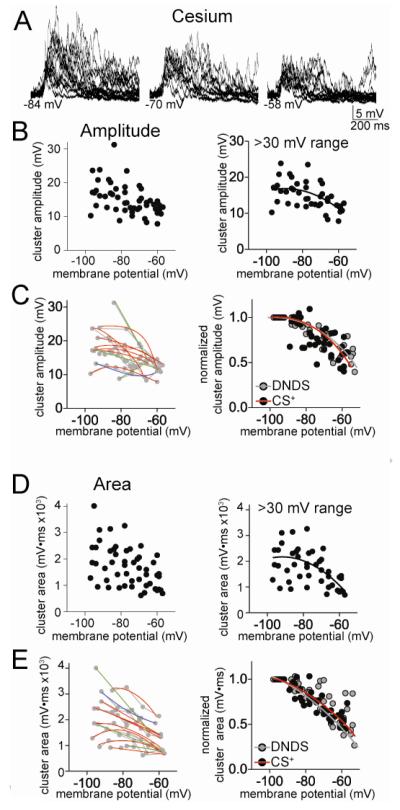
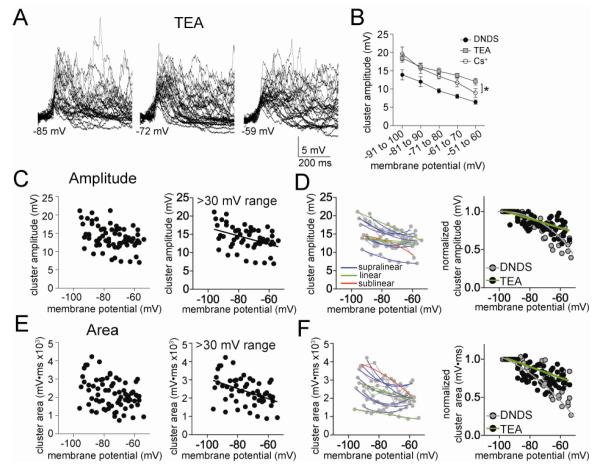
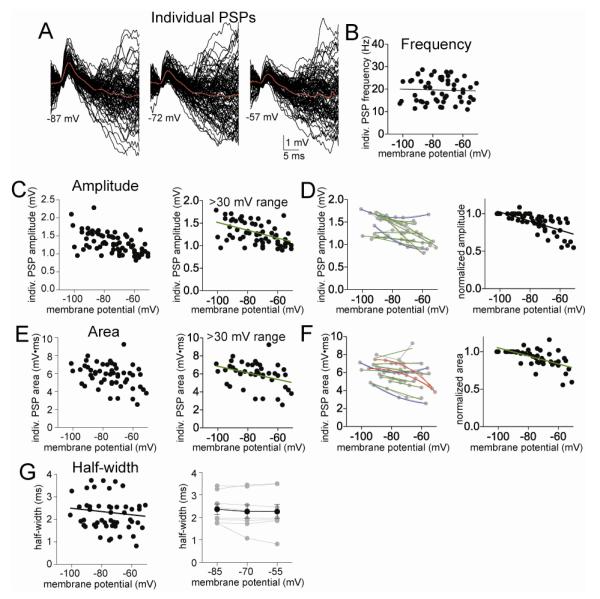
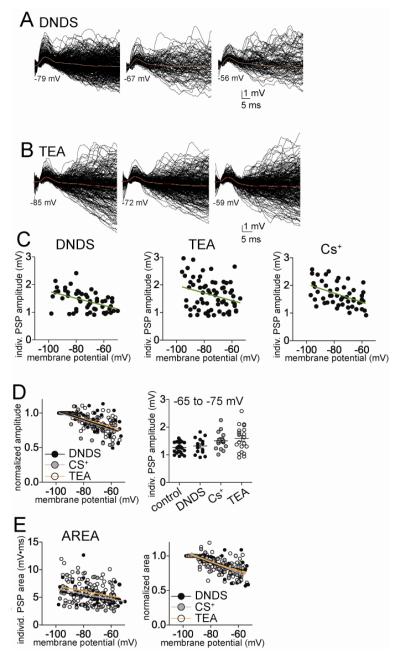
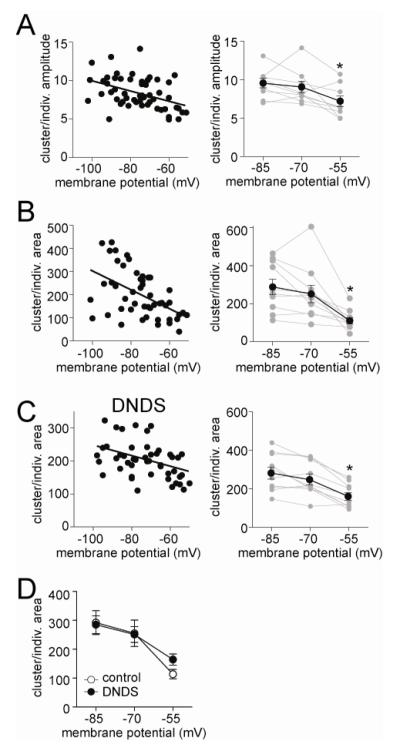
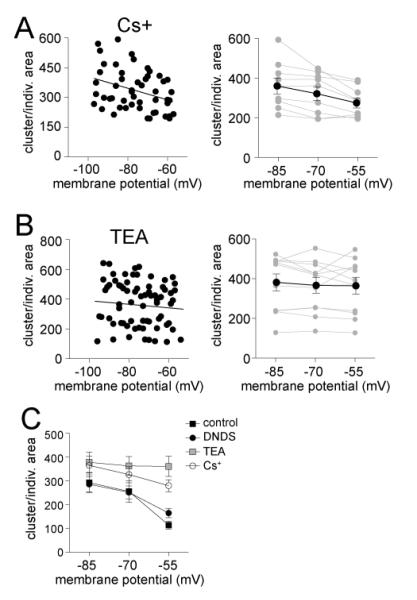
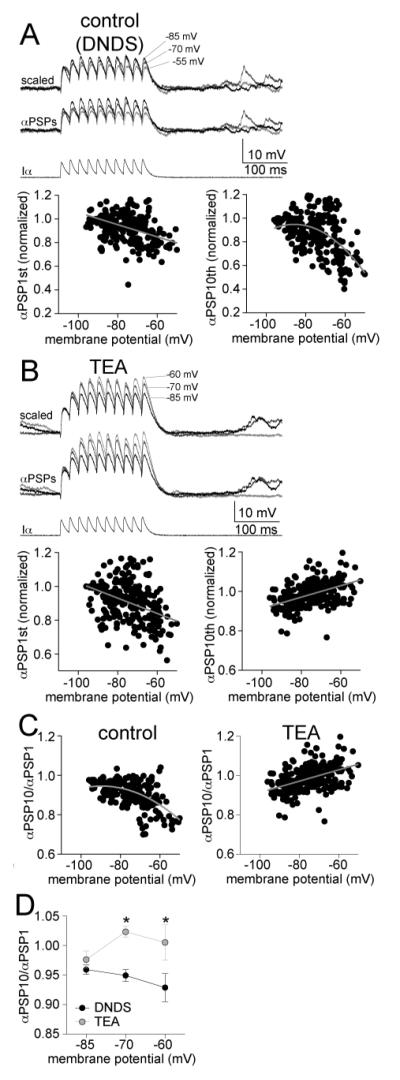
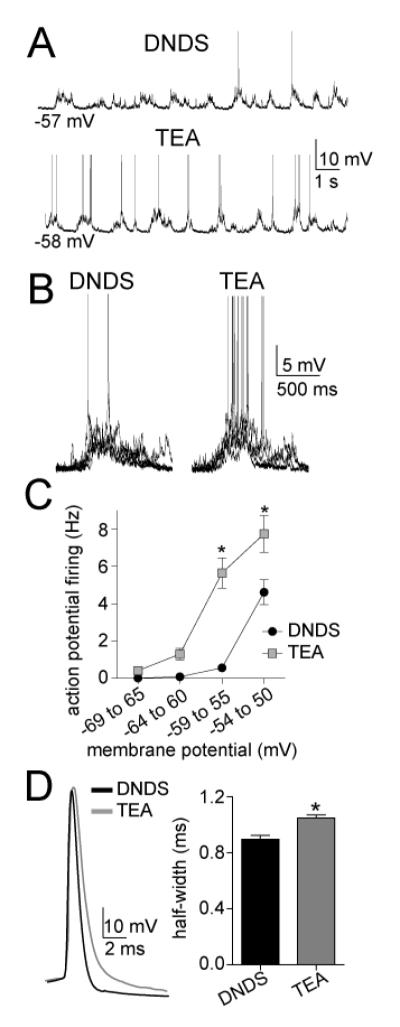
The amygdala has a fundamental role in driving affective behaviors in response to sensory cues. To accomplish this, neurons of the lateral nucleus (LAT) must integrate a large number of synaptic inputs. A wide range of factors influence synaptic integration, including membrane potential, voltage-gated ion channels and GABAergic inhibition. However, little is known about how these factors modulate integration of synaptic inputs in LAT neurons in vivo. The purpose of this study was to determine the voltage-dependent factors that modify in vivo integration of synaptic inputs in the soma of LAT neurons. In vivo intracellular recordings from anesthetized rats were used to measure post-synaptic potentials (PSPs) and clusters of PSPs across a range of membrane potentials. These studies found that the relationship between membrane potential and PSP clusters was sublinear, due to a reduction of cluster amplitude and area at depolarized membrane potentials. In combination with intracellular delivery of pharmacological agents, it was found that the voltage-dependent suppression of PSP clusters was sensitive to tetraethylammonium (TEA), but not cesium or a blocker of fast GABAergic inhibition. These findings indicate that integration of PSPs in LAT neurons in vivo is strongly modified by somatic membrane potential, likely through voltage-dependent TEA-sensitive potassium channels. Conditions that lead to a shift in membrane potential, or a modulation of the number or function of these ion channels will lead to a more uniform capacity for integration across voltages, and perhaps greatly facilitate amygdala-dependent behaviors.


Figures

Figure 1
Figure 1
Basic properties of clusters of synaptic events. A) During in vivo intracellular recordings from the LAT of anesthetized rats, spontaneous fluctuations of the membrane potential occur periodically. Their occurrence is time-locked with cortical EEG, regardless of the voltage that the membrane potential is held near (−57 mV, −72 mV and −87 mV displayed here in these traces of intracellular (top; action potentials truncated for space) and EEG (bottom) voltages. B) Spectral power analysis demonstrates that the predominant frequency of the EEG matches the predominant frequency of the intracellular voltage fluctuations (top), and that maximal coherence occurs in this neuron at 0.8 Hz (top, inset). C) Consistent with the synaptic nature of these events, their frequency is not dependent upon the membrane voltage (individual points in plot are the average frequency of events at a specific membrane potential from one neuron).
Figure 2
Figure 2
Cluster amplitude displays non-linear dependence on membrane potential. A) The amplitude of the spontaneous clusters shows strong dependence upon the membrane voltage, displayed here as overlays of spontaneous clusters at several different membrane potentials (−88 mV, −72 mV, and −60 mV). B) The peak amplitude of the PSP clusters displays a clear dependence upon membrane voltage (left; here and in similar plots below, each point represents an average from one neuron at a specific membrane potential). Data are best fit with a sublinear fit compared to linear (included here are only neurons with data points from at least a 30 mV range of membrane potentials). C) When data points from individual neurons are fit, it was found that most neurons were best-fit with a sub-linear fit compared to linear (red line represents a sublinear fit, green line represents a linear fit, grey lines connect data points from individual neurons). D) When the values from each neuron are normalized to their peak amplitude, the relationship between membrane potential and cluster amplitude is best fit with a non-linear relationship.
Figure 3
Figure 3
Minimal influence of fast GABAergic inhibition on clusters of PSPs. A) Fast GABAA IPSPs can be blocked by inclusion of DNDS in the recording pipette. When DNDS is added, fast IPSPs are absent (compare with Fig 1, intracellular recording at −57 mV; action potentials truncated for space). B) For comparison, depicted are the overlays of 5 consecutive PSP clusters from a control neuron, and neuron with DNDS. Note the presence of hyperpolarizing deflections in controls, and their absence in the presence of DNDS. C) There is a reduction of cluster amplitude at depolarized membrane potentials in the presence of DNDS (left). This relationship is sublinear (right; included in this analysis are only neurons with >30 mV range of data points). D) When data points from individual neurons are fit, it was found that most neurons were best-fit with a sub-linear fit compared to linear (left; red line represents a sublinear fit, green line represents a linear fit, grey lines connect data points from individual neurons). When the values from each neuron are normalized to their peak amplitude, the relationship between membrane potential and cluster amplitude is best fit with a non-linear relationship (right). There was no significant difference in this normalized voltage dependence between DNDS and control. E) There is a reduction of cluster area at depolarized membrane potentials in the presence of DNDS (left). This relationship is sublinear (right; included in this analysis are only neurons with >30 mV range of data points). F) When data points from individual neurons are fit, it was found that most neurons were best-fit with a sub-linear fit compared to linear (left; red line represents a sublinear fit, green line represents a linear fit, grey lines connect data points from individual neurons). When the values from each neuron are normalized to their peak area, the relationship between membrane potential and cluster area is best fit with a non-linear relationship (right). There was no significant difference in this normalized voltage dependence between DNDS and control.
Figure 4
Figure 4
Cesium-sensitive channels do not underlie the sublinear voltage-dependence of clusters. A) When Cs+ is included in the electrode to block a subset of K+ hannels, the amplitude of clusters is still dependent upon the membrane potential (depicted here are overlays of consecutive clusters recorded at −84, −70 and −58 mV). B) There is a reduction of cluster amplitude at depolarized membrane potentials in the presence of Cs+ (left). This relationship is sublinear (right; included in this analysis are only neurons with >30 mV range of data points). C) When data points from individual neurons are fit, it was found that most neurons were best-fit with a sub-linear fit compared to linear (left; red line represents a sublinear fit, green line represents a linear fit, blue line represents a supralinear fit). When the values from each neuron are normalized to their peak amplitude, the relationship between membrane potential and cluster amplitude is best fit with a non-linear relationship (right). There was no significant difference in this normalized voltage dependence between Cs+ and DNDS control. D) There is a reduction of cluster area at depolarized membrane potentials in the presence of Cs+ (left). This relationship is sublinear (right; included in this analysis are only neurons with >30 mV range of data points). E) When data points from individual neurons are fit, it was found that most neurons were best-fit with a sub-linear fit compared to linear (left; red line represents a sublinear fit, green line represents a linear fit, blue line represents a supralinear fit, grey lines connect data points from individual neurons). When the values from each neuron are normalized to their peak area, the relationship between membrane potential and cluster area is best fit with a non-linear relationship (right). There was no significant difference in this normalized voltage dependence between Cs+ and DNDS control.
Figure 5
Figure 5
TEA-sensitive channels do underlie the sublinear voltage-dependence of clusters. A) When TEA is included in the electrode to block a subset of voltage-dependent K+ channels, the amplitude of clusters is still dependent upon the membrane potential (depicted here are overlays of consecutive clusters recorded at −85, −72 and −59 mV). B) When the relationship between cluster amplitude and membrane potential was analyzed in 10 mV segments, a significant effect of TEA emerged on cluster amplitude. C) There is a reduction of cluster amplitude at depolarized membrane potentials in the presence of TEA (left). This relationship is linear (right; included in this analysis are only neurons with >30 mV range of data points). D) When data points from individual neurons are fit, it was found that most neurons were best-fit with a supra-linear or linear fit compared to sublinear (left; red line represents a sublinear fit, green line represents a linear fit, blue line represents a supralinear fit, grey lines connect data points from individual neurons). When the values from each neuron are normalized to their peak amplitude, the relationship between membrane potential and cluster amplitude is best fit with a linear relationship when TEA was present (right). There was a significant difference in this normalized voltage dependence between TEA and DNDS control. E) There is a reduction of cluster area at depolarized membrane potentials in the presence of TEA (left). This relationship is linear (right; included in this analysis are only neurons with >30 mV range of data points). F) When data points from individual neurons are fit, it was found that most neurons were best-fit with a supra-linear or linear fit compared to sub-linear (left; red line represents a sublinear fit, green line represents a linear fit, blue line represents a supralinear fit, grey lines connect data points from individual neurons). When the values from each neuron are normalized to their peak area, the relationship between membrane potential and cluster area is best fit with a linear relationship (right). There was a significant difference in this normalized voltage dependence between TEA and DNDS control.
Figure 6
Figure 6
Individual PSPs do not display a sublinear voltage-dependence. A) The amplitude of individual PSPs depends upon the voltage at which the membrane potential is held, displayed here as the overlays of PSPs measured at −87 mV, −72 mV, and −57 mV. B) There is no significant relationship between the frequency of PSPs and the membrane potential. C) The peak amplitudes of PSPs display a clear dependence upon membrane voltage (left). Data are best fit with a linear fit compared to non-linear (right; included here are only neurons with data points from at least a 30 mV range of membrane potentials). D) When data points from individual neurons are fit, it was found that most neurons were best-fit with a linear fit compared to non-linear (left; red line represents a sublinear fit, green line represents a linear fit, grey lines connect data points from individual neurons). When the values from each neuron are normalized to their peak amplitude, the relationship between membrane potential and PSP amplitude is best fit with a linear relationship (right). E) The areas of PSPs display a clear dependence upon membrane voltage (left). Data are best fit with a linear fit compared to non-linear (right; included here are only neurons with data points from at least a 30 mV range of membrane potentials). F) When data points from individual neurons are fit, it was found that most neurons were best-fit with a linear fit compared to non-linear (left; red line represents a sublinear fit, green line represents a linear fit, grey lines connect data points from individual neurons). When the values from each neuron are normalized to their peak area, the relationship between membrane potential and PSP area is best fit with a linear relationship (right). G) There was no significant relationship between PSP half-width and membrane potential (left), even when only data from equivalent membrane potentials were compared across a separate group of neurons (right).
Figure 7
Figure 7
Individual EPSPs display a linear relationship to membrane potential when GABA or K+ channels are blocked. A) The amplitude of EPSPs displays a dependence on the membrane potential when GABA channels are blocked with intracellular DNDS (left; displayed here are overlays of consecutive EPSPs measured from −79, −67 and −56 mV). The relationship between EPSP amplitude and membrane potential is best fit with a linear compared to non-linear function (right). B) The amplitude of EPSPs displays a dependence on the membrane potential when voltage-dependent K+ channels are blocked with intracellular TEA (displayed here are overlays of consecutive EPSPs measured from −85, −72 and −59 mV). The relationship between EPSP amplitude and membrane potential is best fit with a linear compared to non-linear function (right). C) Similarly, when other K+ channels are blocked with intracellular Cs+, the relationship between EPSP amplitude and membrane potential is best fit with a linear compared to non-linear function. D) The best-fit of the relationship between normalized EPSP amplitude and membrane potential is not significantly different between DNDS, Cs+ and TEA. E) The relationship between EPSP area and membrane potential is best fit with linear functions in DNDS, Cs+ and TEA conditions (left). The best fit of the relationship between normalized EPSP area and membrane potential is not significantly different between DNDS, Cs+ and TEA (right).
Figure 8
Figure 8
Relationship between individual PSPs and clusters of PSPs depends upon the membrane voltage. A) The relationship between clusters and individual PSP amplitudes, quantified as the cluster amplitude normalized to individual PSP amplitude, displays a dependence upon the membrane potential (left), indicating that at depolarized membrane potentials individual PSPs are not as effective at summating into larger PSP clusters. In a separate group of neurons, the membrane potential was held at three predefined vales (−85 mV, −70 mV, −55 mV; right) to allow more accurate between-neuron comparisons. The relationship between cluster and individual PSP amplitude was significantly dependent upon the membrane voltage. B) The relationship between clusters and individual PSPs area is dependent upon the membrane potential across all neurons (left), and when measured in a separate group of neurons with the membrane potential held near predefined values (−85 mV, −70 mV, −55 mV; right). There is a significant reduction in the relationship ratio at depolarized membrane potentials. C) In the presence of intracellular DNDS, the relationship between clusters and individual PSPs area is dependent upon the membrane potential across all neurons (left), and when measured in a separate group of neurons with the membrane potential held near predefined values (−85 mV, −70 mV, −55 mV; right). There is a significant reduction in the relationship ratio at depolarized membrane potentials. D) Intracellular DNDS did not significantly alter the voltage dependence of the relationship between clusters and PSPs (replotted here are panel B, left and C, left). * indicates p<0.05, post-hoc Tukeys test after one way repeated-measures ANOVA.
Figure 9
Figure 9
TEA but not cesium mitigates the voltage-dependence of the relationship between PSP and clusters. A) Cesium (Cs+) was included in the recording pipette to block a subset of ion channels that are active near Vrest. With Cs+ present the relationship between clusters and individual PSPs (measured as the ratio of their areas), was significantly dependent upon membrane potential (left), even when analyzed from predefined membrane potential values (−85 mV, −70 mV, −55 mV; right), indicating that Cs+ does not block the voltage-dependence of integration of PSPs. B) TEA was included in the recording pipette to block a range of voltage-sensitive K+ channels. When TEA was included in the pipette there was no significant voltage-dependence of the relationship between PSP clusters and individual PSPs, measured as the slope of the area ratio as a function of membrane potential (left), or as the ratio at predefined membrane potentials (−85 mV, −70 mV, −55 mV; right). F) The ratio of cluster and individual PSP area indicates that PSPs summate more effectively in the presence of Cs+ and TEA, and that ability is not dampened at depolarized membrane potentials when TEA is present, compared to the other groups. This is consistent with a blockade of voltage-sensitive K+ channels that suppress summation of inputs. * indicates p<0.05, post-hoc Tukeys test after one way repeated-measures ANOVA.
Figure 10
Figure 10
Summation of αPSPs is voltage- and TEA sensitive. A) To test the impact of voltage-gated K+ channels on summation of inputs in a more controlled manner, EPSC-shaped currents were injected into the soma to induce EPSP-shaped potentials (αPSPs). In DNDS control conditions, there was a suppression of αPSP trains at depolarized membrane potentials. This is represented as a reduction of the αPSP trains amplitude as the membrane potential is depolarized. This relationship is best-fit with a sublinear compared to linear function (right). However, the amplitude of the first αPSP in the train displays a small reduction of amplitude with depolarization (left), best fit with a linear function. B) In the presence of TEA, there was an enhancement of αPSP train amplitude at depolarized membrane potentials (right). This was best-fit with a linear function with a positive slope. However, the amplitude of the first αPSP in the train displays a small reduction of amplitude with depolarization (left), best fit with a linear function. C) Summation at depolarized membrane potentials (measured as the last αPSPs/first αPSPs) was suppressed at depolarized membrane potentials in the presence of DNDS and best fit with a sublinear function (left), but enhanced by TEA and best fit with a linear function (right). D) TEA significantly enhanced the summation of αPSP compared to the DNDS control. * indicates p<0.05 in post-hoc Tukeys following significance in a two-way repeated measures ANOVA.
Figure 11
Figure 11
TEA increases the frequency of action potentials evoked by PSP clusters. A) Intracellular TEA increases the number of action potentials induced by spontaneous PSP clusters, consistent with increased summation of PSPS. B) This is readily observable when PSP clusters are overlayed in the presence of DNDS (left) compared to TEA (right). C) The frequency of action potential firing is significantly different over a range of membrane potentials. D) The half-width of action potentials was significantly longer when TEA was included in the pipette, consistent with an expected effect on voltage-gated K+ channels. * indicates p<0.05 in post-hoc Tukeys following significance in a two-way repeated measures ANOVA, or in t-test.

Similar articles

Cited by

References

    1. Anderson JS, Carandini M, Ferster D. Orientation tuning of input conductance, excitation, and inhibition in cat primary visual cortex. J Neurophysiol. 2000;84:909–926. - PubMed
    1. Andreasen M, Lambert JD. Somatic amplification of distally generated subthreshold EPSPs in rat hippocampal pyramidal neurones. J Physiol. 1999;519(Pt 1):85–100. - PMC - PubMed
    1. Bernander O, Douglas RJ, Martin KA, Koch C. Synaptic background activity influences spatiotemporal integration in single pyramidal cells. Proc Natl Acad Sci U S A. 1991;88:11569–11573. - PMC - PubMed
    1. Borg-Graham L, Monier C, Fregnac Y. Voltage-clamp measurement of visually-evoked conductances with whole-cell patch recordings in primary visual cortex. J Physiol Paris. 1996;90:185–188. - PubMed
    1. Branco T, Hausser M. Synaptic integration gradients in single cortical pyramidal cell dendrites. Neuron. 2011;69:885–892. - PMC - PubMed

Publication types