Comparative Study
. 2012 Nov 15;120(20):4172-81.
doi: 10.1182/blood-2012-06-437608. Epub 2012 Sep 18.

Differential infection patterns of CD4+ T cells and lymphoid tissue viral burden distinguish progressive and nonprogressive lentiviral infections

Affiliations
Comparative Study

Differential infection patterns of CD4+ T cells and lymphoid tissue viral burden distinguish progressive and nonprogressive lentiviral infections

Jason M Brenchley et al. Blood. .

Erratum in

  • Blood. 2014 Jun 26;123(26):4152

Abstract

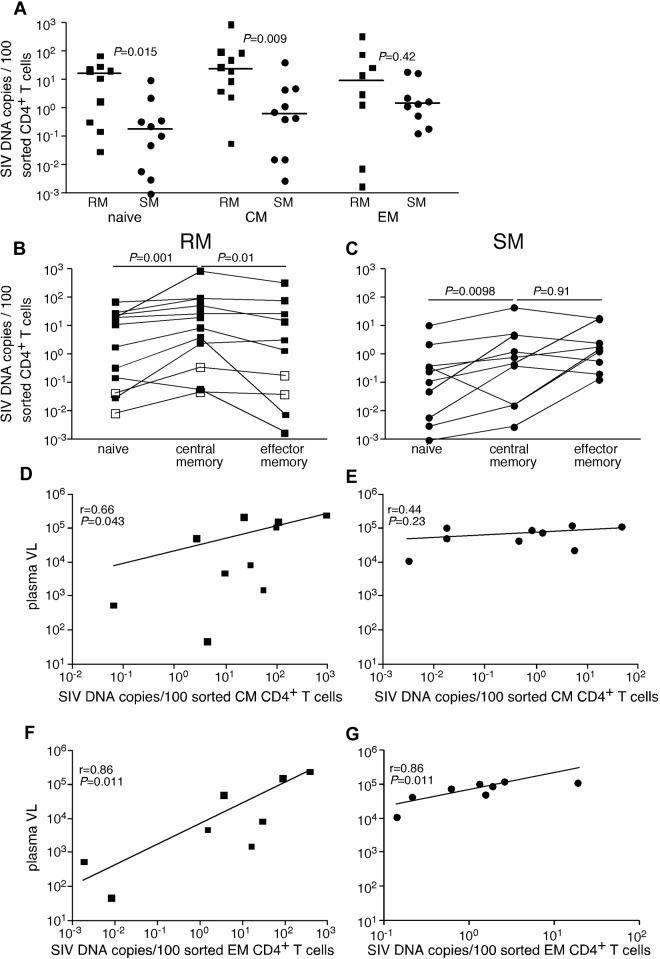
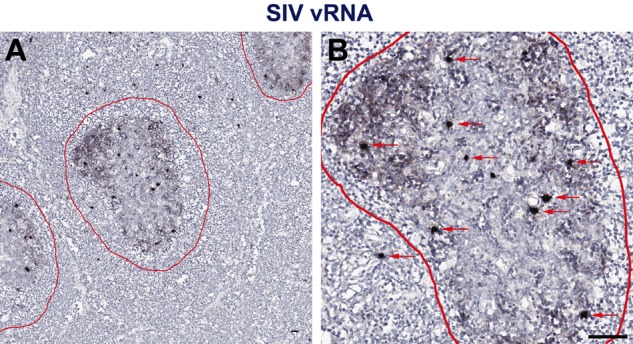
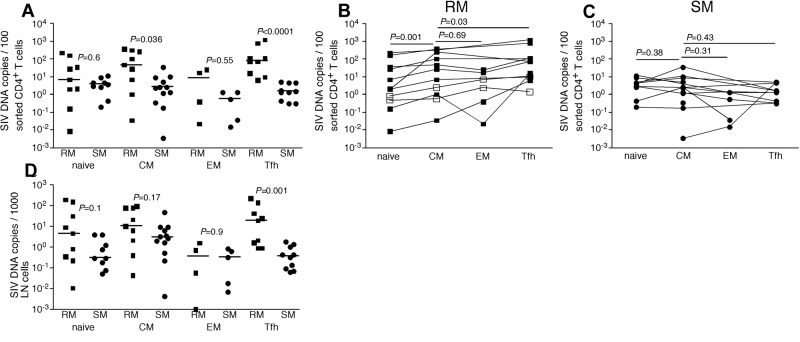
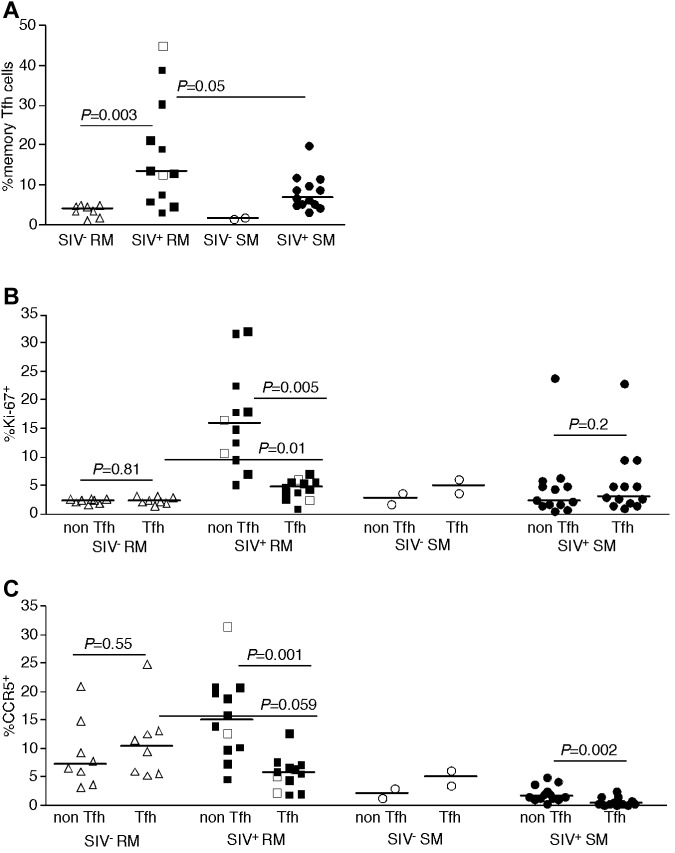
Nonhuman primate natural hosts for simian immunodeficiency viruses (SIV) develop a nonresolving chronic infection but do not develop AIDS. Mechanisms to explain the nonprogressive nature of SIV infection in natural hosts that underlie maintained high levels of plasma viremia without apparent loss of target cells remain unclear. Here we used comprehensive approaches (ie, FACS sorting, quantitative RT-PCR, immunohistochemistry, and in situ hybridization) to study viral infection within subsets of peripheral blood and lymphoid tissue (LT) CD4(+) T cells in cohorts of chronically SIV-infected rhesus macaques (RMs), HIV-infected humans, and SIVsmm-infected sooty mangabeys (SMs). We find: (1) infection frequencies among CD4(+) T cells in chronically SIV-infected RMs are significantly higher than those in SIVsmm-infected SMs; (2) infected cells are found in distinct anatomic LT niches and different CD4(+) T-cell subsets in SIV-infected RMs and SMs, with infection patterns of RMs reflecting HIV infection in humans; (3) T(FH) cells are infected at higher frequencies in RMs and humans than in SMs; and (4) LT viral burden, including follicular dendritic cell deposition of virus, is increased in RMs and humans compared with SMs. These data provide insights into how natural hosts are able to maintain high levels of plasma viremia while avoiding development of immunodeficiency.


Figures

Figure 1
Figure 1
SIV infection of CD4+ T-cell subsets in peripheral blood of RMs and SMs. Naive (CD28dullCCR7+CD95), TCM (CCR7+CD95+), and TEM (CCR7CD95+) CD4+ T cells were flow cytometrically sorted from peripheral blood of SIVsmmE543-infected RMs (■), SIVmac239-infected RMs (□), and SIVsmm-infected SMs (●), and infection levels of individual subsets were determined by quantitative PCR. Infection frequencies of individual subsets are compared between RMs and SMs (A). Infection frequencies of different subsets are compared within RMs (B) and SMs (C). Horizontal lines represent the median. P values are based on the Mann-Whitney test (A) or the Wilcoxon matched pairs test (B-C). Correlation between plasma viral loads and infection frequencies of TCM (D-E) and TEM (F-G) in peripheral blood of SIV-infected RM (D,F) and SIV-infected SM (E,G). Lines are based on linear regression and r and P values are based on Spearman rank correlation coefficient.
Figure 2
Figure 2
In situ hybridization vRNA patterns in secondary lymphoid tissues in chronically SIV-infected RMs. In situ hybridization signal at (A) low magnification and (B) high magnification within the secondary lymphoid tissue shows 2 distinct and distinguishable patterns: (1) FDC-trapped virions showing a typical “lattice-like” diffuse vRNA pattern, and (2) productively infected vRNA+ T cells showing a strong intense spherical staining pattern. Follicles are outlined in red. Red arrows indicate productively infected SIV vRNA+ cells. Scale bars represent 50 μm.
Figure 3
Figure 3
LN anatomic distribution of productively infected cells in RMs, humans, and SMs. (A) Quantitation of the number of SIV/HIV vRNA+ cells/mm2 in LNs of chronically infected RMs, humans, and SMs. (B) Frequency of SIV/HIV vRNA+ cells located within B-cell follicles in LNs of chronically infected RMs, humans, and SMs. (C) The percentage of LN area that consists of B-cell follicles. (D) The percentage LN area of Gag+ (SIVp17+ or HIVp24+) FDCs in chronically infected RMs, humans, and SMs. (E) Combination SIV/HIV in situ hybridization and CD20 IHC showing the relative frequency of SIV/HIV vRNA+ cells located within B-cell follicles (arrowheads) and in the extrafollicular T-cell zone (arrows) in a representative RM, human, and SM at low magnification (top panels) and high magnification (bottom panel). Scale bars represent 50 μm. (F) SIVp17/HIVp24 Gag IHC showing the relative amount of FDC trapped SIV/HIV from 2 chronically infected RMs, humans and SMs. Note the dramatic variability in FDC trapping in SM compared with RM and human. Scale bars represent 50 μm. Horizontal lines represent the median. P values are based on the Mann-Whitney test.
Figure 4
Figure 4
SIV infection of CD4+ T-cell subsets in LNs of RMs and SMs. Naive (CD28dull,CCR7+CD95), TCM (CCR7+CD95+), TEM (CCR7CD95+), and TFH (CCR7PD-1+ICOS+CTLA-4+CD95+) CD4+ T cells were flow cytometrically sorted from LNs of SIVsmmE543-infected RMs (■), SIVmac239-infected RMs (□), and SIVsmm-infected SMs (●), and infection levels of individual subsets were determined by quantitative PCR. Infection frequencies of individual subsets are compared between RMs and SMs (A). Infection frequencies of different subsets are compared within RMs (B) and SMs (C). Numbers of CD4+ T cells in each subset containing viral DNA per 1000 total LNMCs. Horizontal lines represent the median. P values are based on the Mann-Whitney test (A,D) or the Wilcoxon matched pairs test (B-C).
Figure 5
Figure 5
Phenotype of LN-resident CD4+ T-cell subsets of RMs and SMs. Frequencies of TFH (CCR7PD-1+ICOS+CTLA-4+CD95+) CD4+ T cells among memory (CD28brightCD95+) T cells was determined in SIV-uninfected RMs (▵), SIVsmmE543-infected RMs (■), SIVmac239-infected RMs (□), SIV-uninfected SMs (○), and SIVsmm-infected SMs (●) by flow cytometry (A). Expression of Ki-67 (B) and CCR5 (C) by subsets of LN CD4+ T cells. Horizontal lines represent the median. P values are based on the Mann-Whitney test.

References

    1. Hahn BH, Shaw GM, De Cock KM, Sharp PM. AIDS as a zoonosis: scientific and public health implications. Science. 2000;287(5453):607–614. - PubMed
    1. Pandrea I, Sodora DL, Silvestri G, Apetrei C. Into the wild: simian immunodeficiency virus (SIV) infection in natural hosts. Trends Immunol. 2008;29(9):419–428. - PMC - PubMed
    1. Silvestri G, Paiardini M, Pandrea I, Lederman MM, Sodora DL. Understanding the benign nature of SIV infection in natural hosts. J Clin Invest. 2007;117(11):3148–3154. - PMC - PubMed
    1. Goldstein S, Brown CR, Ourmanov I, et al. Comparison of simian immunodeficiency virus SIVagmVer replication and CD4+ T-cell dynamics in vervet and sabaeus African green monkeys. J Virol. 2006;80(10):4868–4877. - PMC - PubMed
    1. Pandrea I, Apetrei C, Dufour J, et al. Simian immunodeficiency virus SIVagm.sab infection of Caribbean African green monkeys: a new model for the study of SIV pathogenesis in natural hosts. J Virol. 2006;80(10):4858–4867. - PMC - PubMed

Publication types

MeSH terms